
Greetings! In this article, I will go over my technical analysis I did today and explain what indicators were notable and future potential scenarios of the Ethereum price action.
Rally is over?
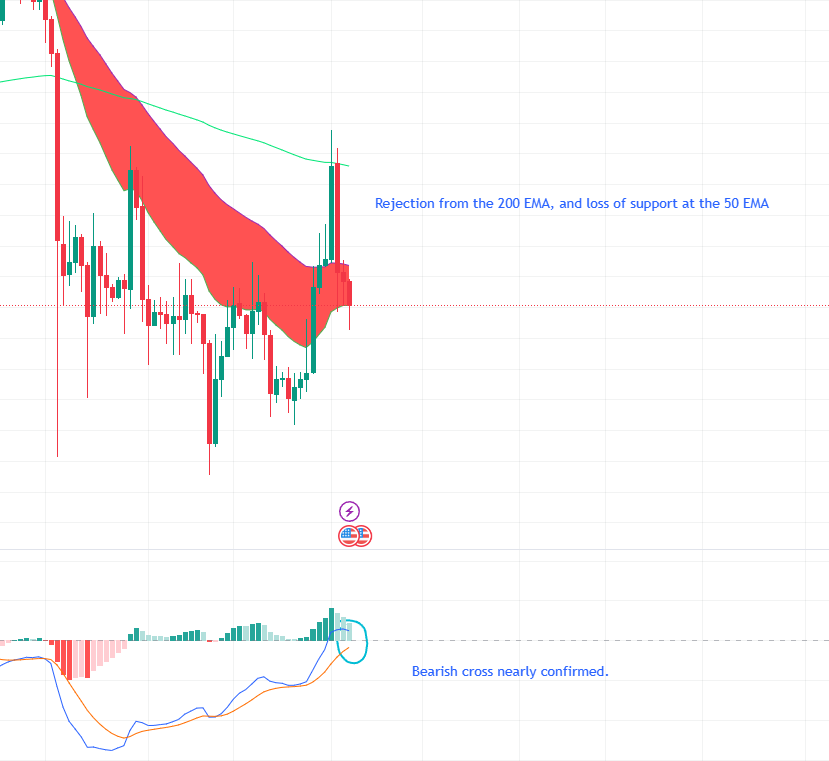
During the past couple of days, Ethereum has been meeting strong resistance at the 1.73k resistance, which has resulted in a correction towards 1.64k. When looking at it closer in the daily EMA perspective, Ethereum got rejected from the 200 EMA and couldn't find support on the 50 EMA and finally found support on the 20 EMA. This is unfortunately a bearish sign of a lack of bullish support. However, the strong reaction to the 20 EMA support level may confirm a higher low.
When it comes to the daily MACD, it is unfortunately forming a bearish cross. This means that during the next couple of weeks, Bitcoin could be heading to lower price targets. However, due to the daily RSI retreating to neutral territories, it is likely that despite the MACD forming a bearish cross, the next bearish move will most likely be very minimal. The 4-hour MACD and RSI shows a different story. Currently, the MACD is very low, and the RSI is also nearing oversold territories. This indicates that perhaps, if Ethereum can maintain support in the 20 EMA level, it can gain momentum and eventually rally towards higher price targets. The weekly MACD is also very bullish, with it currently forming a bearish cross.
Conclusion
In conclusion, the indicators on the daily timeframe are relatively bearish, with the price being lower than the 200 and 50 EMAs and along with the bearish cross formation. However, the indicators on the four-hour time frame shows a possibility of a rally within the next couple of days. Overall, it is more likely than not that Ethereum will retreat to 1.5k before a stronger rally.


