
Greetings! In this article, I will go over my technical analysis I did today and explain what indicators were notable and future potential scenarios of the Ethereum price action.
1.44k Signal Confirmed?
During the past couple of days, despite Bitcoin being relatively bullish, Ethereum has still remained bearish. It was once again rejected by the daily EMA resistance levels and was brought back down towards 1.54k. This indicates that Ethereum is likely to hit lower price targets from here on.
4-hour time frame:
In the 4-hour time frame, the RSI is nearly at oversold territories along with the MACD currently in a bearish channel. This can be seen as relatively bullish, as it means that within the next day or so, Ethereum is unlikely to go below the 1.5k support region and eventually, Ethereum will form a bullish cross on the MACD (Which would reset RSI to neutral/overbought territories along with the MACD into bullish regions). However, despite this, the daily timeframe appears to be more bearish than bullish.
24-hour time frame:
In the 24-hour time frame, the RSI is still in neutral territories, however, it is leaning towards oversold territories. The MACD bullish cross that was nearly formed a few days ago was also invalidated (Which is bearish). Furthermore, Ethereum was rejected yet again from the 20 EMA resistance level on the daily time frame and pushed back to the 1.5k-1.55k support levels. This unfortunately indicates that Ethereum is not ready to seek higher price targets within the near future, as it lacks the bullish momentum to do so.
Weekly time frame:
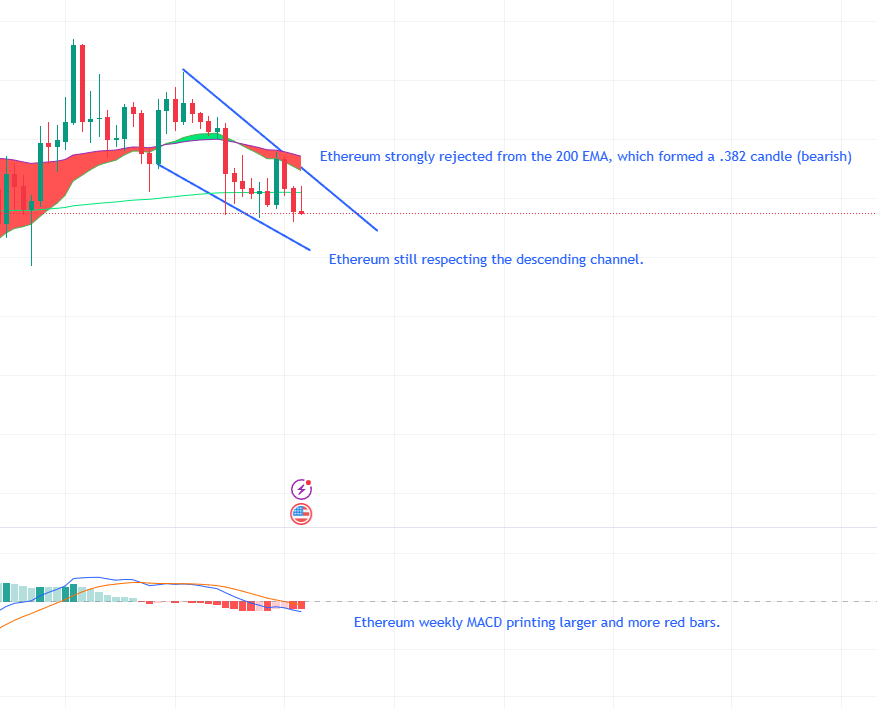
In the weekly time frame, the RSI is still within neutral territories, however, it is still under the RSI resistance. The MACD is currently still printing larger red bars every week (After the bullish cross that nearly formed was invalidated). These indicators mean that currently, the upside potential of Ethereum is severely limited. Furthermore, Ethereum was strongly rejected from the 200 EMA level of resistance, thus forming a .382 bearish candle (Which indicates a loss of bullish momentum). Overall, the indicators shown on the weekly time frame shows Ethereum in a very restrictive range when it comes to the upside.
Conclusion:
Based on the technical analysis shown on all the time frames below, it is safe to conclude that Ethereum, currently, is relatively bearish (With the upside currently being restricted) and is still respecting the descending channel. In the moment, Ethereum can be projected to hit the 1.44k-1.4k price regions based on the bottom support line along the descending channel.


