
Greetings! In this article, I will go over today's move and will use technical analysis to analyze the potential next steps for the Bitcoin price action.
Bullish Reversal or Bear Rally?
Today, Bitcoin pumped from the low 25.5k's to 26.4k. While this may seem like a bullish reversal, technical indicators reveal that this pump is most likely a dumping indicator.
The 24 HR RSI recently hit the bearish resistance line and as well as the 50 EMA. Furthermore, the price action is yet to hit the 200 EMA once again and the 20 EMA is currently well-under the 50 EMA, which means that there is still more of a bearish side to come.
Shown here:
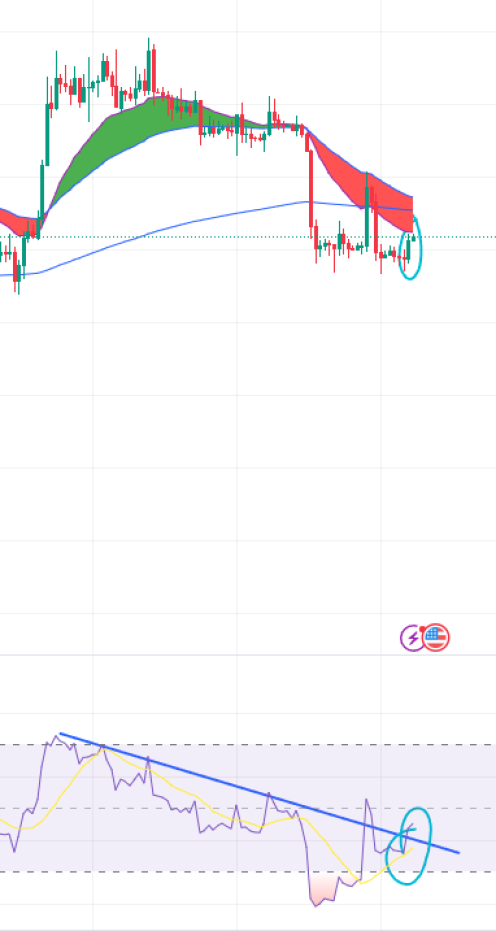
The RSI (In the bottom purple graph) clearly shows that it is well under the current bearish trend line resistance formed. On the price chart, the 20/50 EMA indicator shows a definite red, meaning there is more bearish potential for lower drops (it is a green/red indicator is a custom indicator that I made that shows green if the 20 EMA is over the 50 EMA and red if it is below).
Based on all these indications, it is highly likely that this is a bear rally, and we will most likely be seeing lower price targets as time goes on. Additionally, if this pump gets rejected, it will confirm a lower high and thus form a bearish divergence.
Macro Technical Analysis:
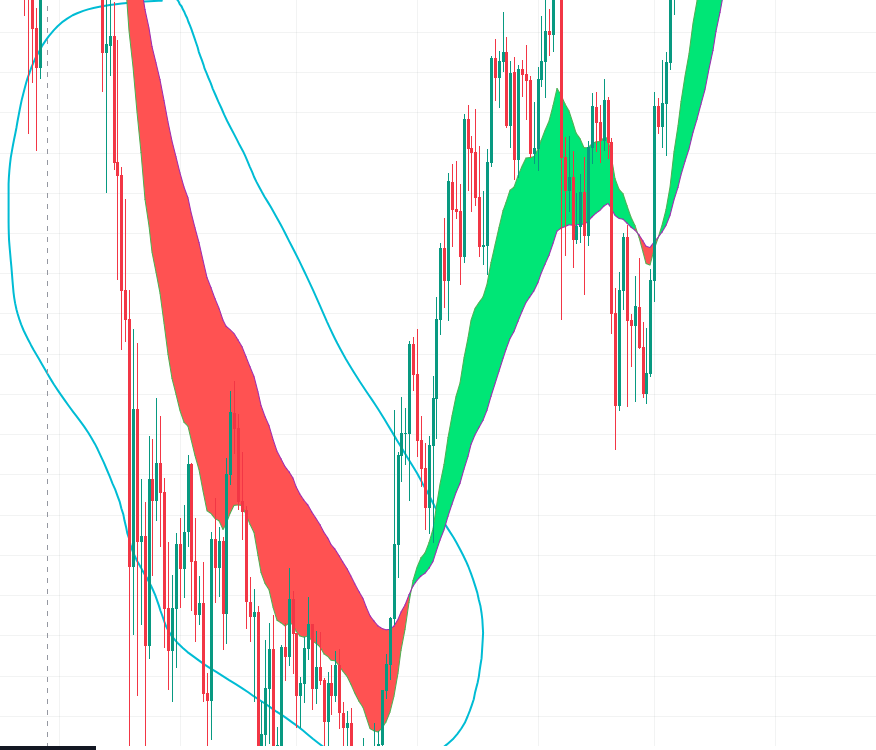
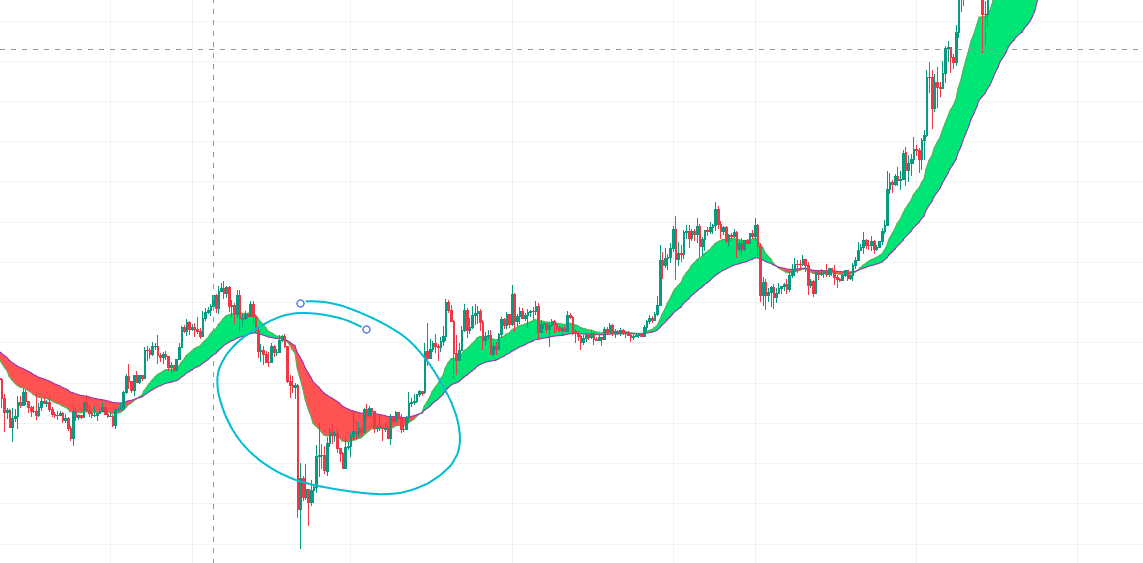
In Bitcoin's history whenever a macro bullish divergence is facing the "final test", the 20 EMA usually goes well-below the 50 ema. This is why I can utilize my 20/50 EMA indicator to conclude that September and October will most likely be the time whether there is a start of a new bull market or not.
This was proven during the beginning of all the past bull markets, as shown here.
This is further supported by the fact that the true ETF decisions come out on October, which at that point, will decide whether the bearish or bullish trend will continue forward.


