
Greetings! In this article, I will go over my technical analysis I did today and explain what indicators were notable and future potential scenarios of the BTC price action.
30K on the horizon?
Yesterday to today, Bitcoin successfully retested the daily 20 EMA support level. This means that within the next few days will be the deciding factor on whether Bitcoin will have a rally towards the 28k-30k levels. In the weekly time frame, Bitcoin is also retesting the 50 EMA, which means that if successfully reclaimed, Bitcoin can easily go to 30k.
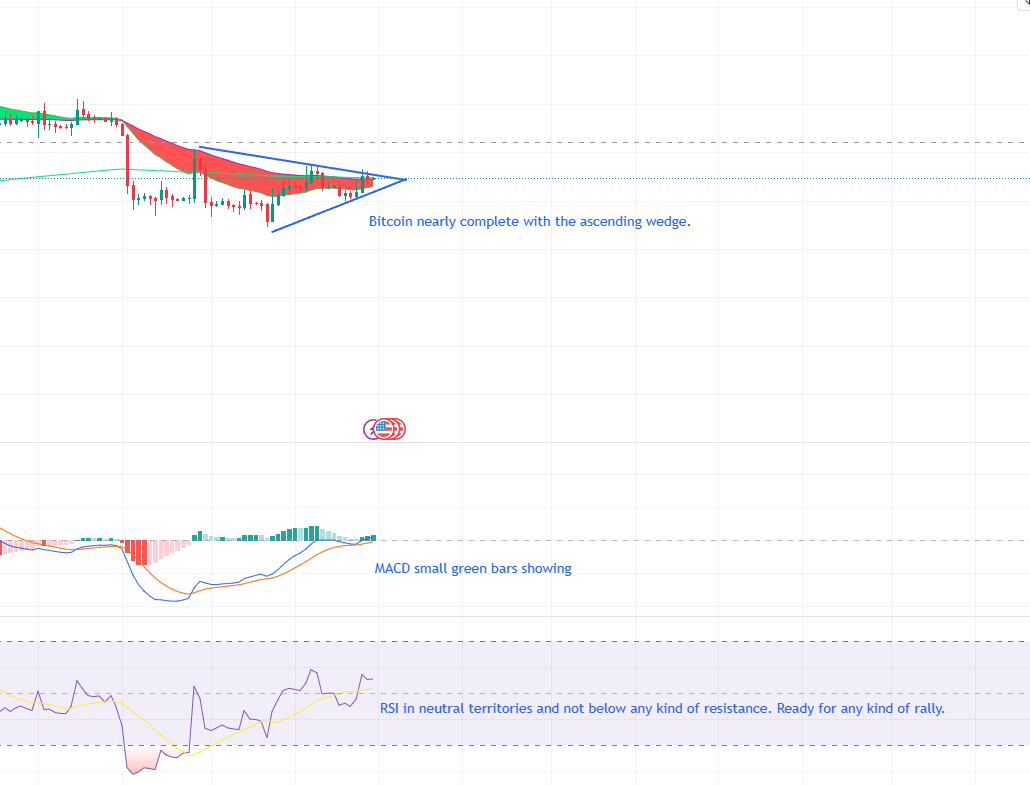
Furthermore, the RSI in the daily and weekly timeframes are relatively neutral. The daily MACD is beginning to show small green bars along with the weekly MACD slowly curving up, which indicates the beginning of a upside move. Additionally, the daily 20 EMA is beginning to curve up and meet the 50 EMA, which would also support the indication of an upside move.
Another bullish indicator is the ascending wedge forming on the daily Bitcoin charts. At the time of writing this, Bitcoin has nearly completed the ascending wedge. Once the ascending wedge completes, there is a large volatile move towards the upside or downside. Due to the other relatively bullish technical indicators, it is more likely for a large move to the upside.
Conclusion
With the abundance of bullish indicators, it is very likely that we will experience a large rally of some sorts to at least the 28k levels or potentially even 30k levels. However, depending on whether the macroeconomic state of the U.S and the Bitcoin ETF situation improves, it is unlikely that Bitcoin will be able to hit higher targets, simply due to the strong resistance at 30k.


