
Greetings! In this article, I will go over my technical analysis in the weekly time-frame and how it correlates to a slow bleed in price action during the month of September.
Technical Analysis:
In the weekly time-frame, I discovered several concerning indicators and patterns. The current weekly candle shows a bearish 0.382 candle, which indicates a bearish trend within the next few weeks. Furthermore, the weekly MACD formed a bearish cross narrows it down to at a very minimum, another weekly bearish candle.
Additionally, the weekly RSI is in neutral territory AND is in a bearish divergence trend (This is a very bearish indicator coming from RSI due to the fact that BTC has more downside potential but little breakout potential). On top of this, the current weekly candle is closing below the 200 EMA, which means that the 200 EMA will begin to act as resistance.
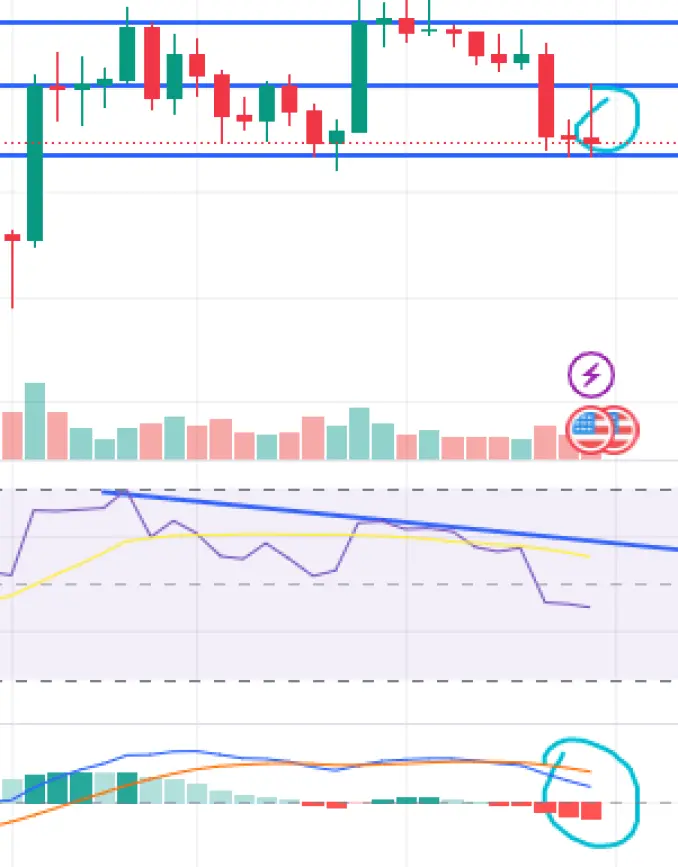
All of this, in the end, supports my theory of a potential downtrend towards the 23k-20k levels during September (Which is historically one of the most bearish months for bitcoin) before a potential reversal during October, November, or December (Which are historically bullish months). I believe that this drop will be a good time for accumulation before the halving and (Highly likely) introduction of BTC ETFs in early 2024.





