
Greetings! In this article, I will go over my technical analysis I did today and explain what indicators were notable and future potential scenarios of the BTC price action.
Small dip then 29k rally?
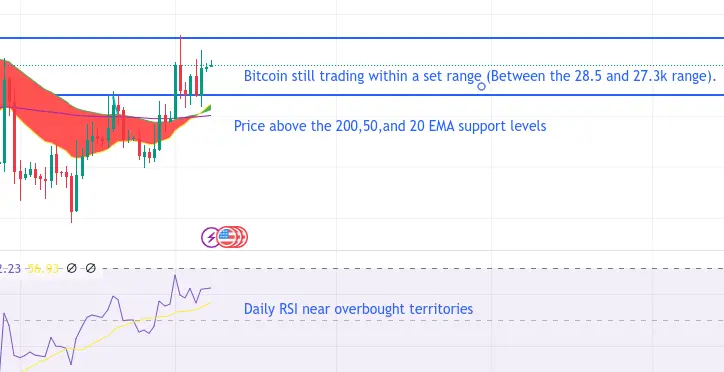
During these past few days, Bitcoin has been consolidating within the 27.4k - 28k range. While this may seem like boring price action, a further look into the technical indicators does reveal that Bitcoin is set for a small dip before perhaps a rally towards the next level of resistance, which is 29k.
4-hour time frame:
In the four-hour time frame, the RSI is still hanging near overbought territories and the MACD is still close to forming a bearish cross. Furthermore, the 20/50 EMA channel (Which the 20 EMA is above the 50 EMA) is still very wide. This means that based on the RSI being near overbought territories, the MACD nearly at the bearish cross, and the 20/50 EMA channel being very wide, it is very likely that a move towards the downside within the next few days is yet to occur. However, this move towards the downside will most likely be very minimal ( towards the 27k support level ) and healthy for the overall trend (It will help reset overbought RSI & MACD in nearly all time frames, including the 24-hour time frame).
24-hour time frame:
In the 24-hour time frame, the RSI is still hanging near overbought territories, just like the 4-hour time frame. However, as I said in the four-hour time frame, the slight move towards the downside will reset the daily RSI towards neutral territories. This would additionally reset the MACD and potentially form a bearish cross. While this move towards the downside will inevitably reset the overbought RSI and MACD indicators, it could cause Bitcoin to go towards lower targets, such as 26.7k, within the next week. However, it is unlikely that Bitcoin will seek lower price targets due to the strong support formed on the 20, 50, and 200 EMAs at the 27k level.
Weekly time frame:
The weekly time frame shows the MACD curving and forming a bullish cross (Which indicates a move towards the upside within the next few weeks). However, at the same time, the RSI, while in neutral territories, is still under strong RSI resistance (Which means that without strong bullish momentum to break it out, it will prevent Bitcoin from seeking higher price targets). Additionally, Bitcoin has also formed a doji candle on this week's candle, which means that a large volatile move is soon to come within the next week or so. While the doji candle does indicate a move in either direction, the bullish cross forming on the MACD does indicate that the volatile move the doji candle is indicating is going to be a rally towards the upside. Furthermore, a large move towards the upside would be enough to break the RSI through the RSI resistance as well. However, if Bitcoin is to move towards the downside, it is most likely going to break through the 20 and 50 EMA support levels and find support at the 200 EMA, which is 25k.
Conclusion:
In conclusion, Bitcoin has a slightly higher chance of having a small dip and a large rally towards 29k rather than a large move towards the downside to 25k.
* Please ignore the same use of the thumbnails for the past couple of articles (I have been using another device for writing articles and I should be able to create new thumbnails soon). *





