
Greetings! In this article, I will go over my technical analysis I did today and explain what indicators were notable and future potential scenarios of the BTC price action.
Revival or Bear Rally?
During the past couple of days, Bitcoin has been on a constant downward trend. However, today, there was a small rally towards 27.243k. Today, I will be going over my technical analysis and lay out potential future steps Bitcoin might take.
4-hour time frame:
In the 4-hour time frame, the RSI nearing overbought territories. The MACD is also in the overbought territory, which would most likely result in a bearish cross within the next day or so. This could mean that Bitcoin will be rejected back into 26.5k price regions. However, closest level of support is 27k, which if Bitcoin manages to find support within those regions, Bitcoin could seek potentially slightly higher price targets.
24-hour time frame:
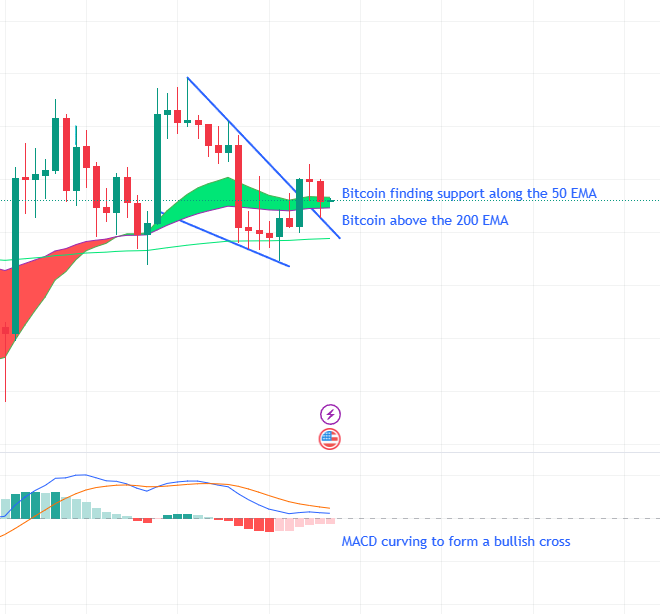
In the 24-hour time frame, the RSI is at neutral territories and the MACD is beginning to curve up and form a bullish cross. These indicate that there is a possibility that Bitcoin could rally towards 28k and break the resistance level. Furthermore, Bitcoin managed to retest the 200, 20, and 50 EMA levels. If Bitcoin manages to find a strong break out of those resistance levels, Bitcoin could seek price levels such as 29k. Additionally, Bitcoin managed to form a higher low in the overall current trend. Overall, in the daily timeframe, things seem relatively bullish.
Weekly time frame:
In the weekly time frame, the RSI is at neutral territories (Still in RSI resistance) and the MACD is still somewhat curving up to form a bullish cross, like the 24-hour time frame. Additionally, Bitcoin managed to find support along 26.5k and rebound directly in between the 20 and 50 EMA levels. This is really bullish, as Bitcoin now recaptured a crucial support level and it also has a strong support for a higher low. However, the RSI resistance means that without enough bullish momentum, Bitcoin cannot seek higher price targets.
Conclusion:
In conclusion, the indicators on all timeframes seem relatively bullish, with Bitcoin reclaiming lost support regions and the conformation of the higher low. The only concerning indicator is the RSI resistance present along the weekly timeframe, which could stunt the upside for Bitcoin.


