Greetings
Welcome to episode 2 of the world of technical analysis, where charts and data help us make sense of the constantly evolving market. In this article, we'll take a closer look at some of the most crucial indicators and patterns, alongside support and resistance levels.
Introduction:
In recent months, Ethereum has been on the rise, showing an ascending parallel channel. However, the market conditions have not been stable, making it difficult to predict the direction of the price movement. In this article, we will analyze the recent price action of Ethereum and provide insights into the current market sentiment.
Reviewing the Recent Price Action:
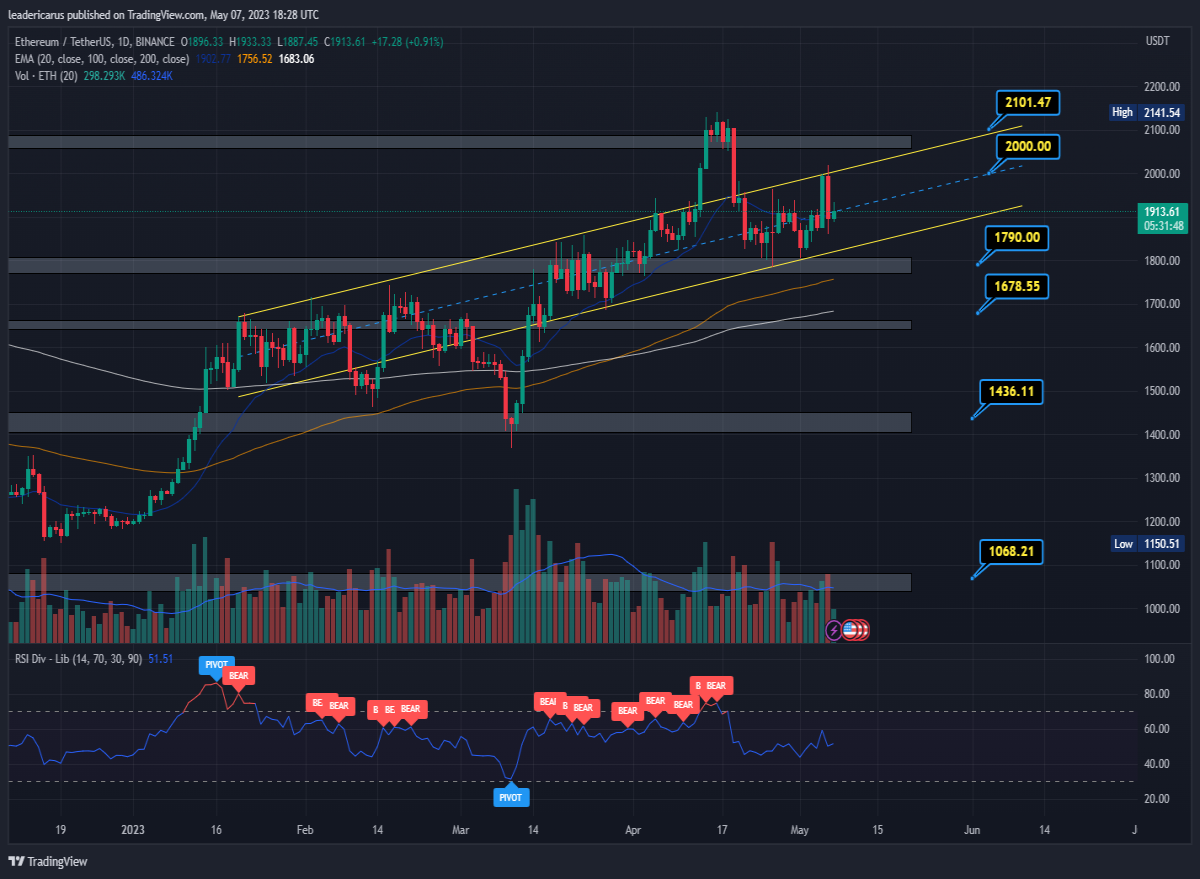
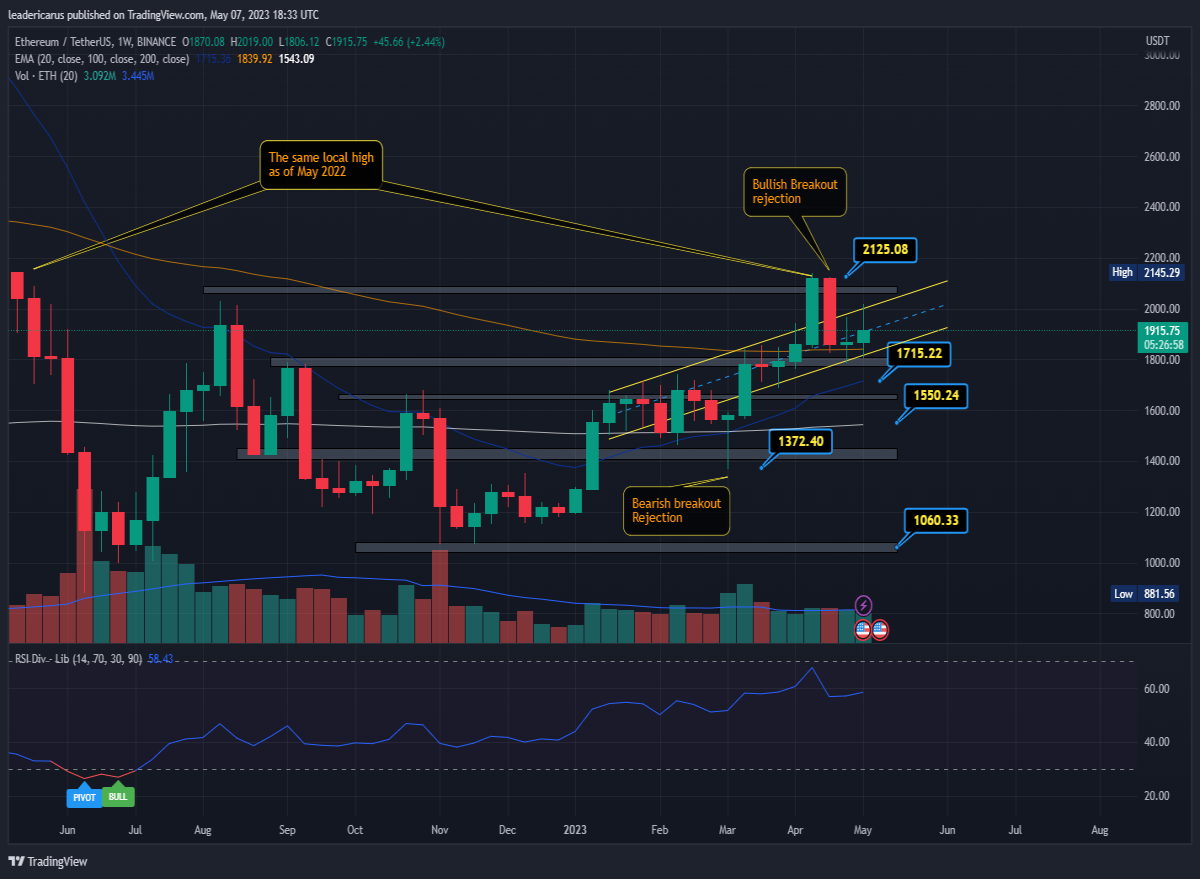
On the short-term charts (4 hours and 1 hour), Ethereum has been showing a range trade between $1800 and $2000. While on the long-term chart (weekly), the EMA20, 100, and 200 are below the current price, indicating a bullish sentiment. The last time we saw this price was in May 2022.
However, there was a bullish breakout attempt that was quickly rejected, forming a local high at around $2120. This indicates that the market is not yet ready for a breakout above $2000. Despite this, the mid-term daily chart shows the EMA100 and 200 well below the current price, which is a bullish sign.
Current Market Conditions:
The price continues to follow the ascending parallel channel, but it is not enough to have a breakout above $2000 yet. This shows that there are better chances that the market will not have a breakout below the channel either. The Ethereum market does not have a clear direction due to current global market conditions and the long-awaited blockchain upgrade.
As we move further into May, we can expect to have a better understanding of the potential price movement. The uncertainty in the market has caused the price to trade around EMA20, indicating a lack of direction.
Conclusion
The recent price action of Ethereum has shown a bullish sentiment, but the market is uncertain due to global conditions and the blockchain upgrade. The mid-term daily chart indicates a bullish sentiment, but the short-term charts show a range trade. The ascending parallel channel provides a clear trading range, but the market is still waiting for a breakout above $2000.
And that's a wrap for this week's technical analysis report. Remember, when it comes to trading, knowledge is power. Stay informed and stay ahead of the game.
Disclaimer
The information provided in this article is for educational and informational purposes only and should not be construed as financial advice. Any investment decisions made based on the information in this article are solely your responsibility. We encourage you to do your own research and seek professional advice before making any investment decisions. Please note that we cannot be held liable for any profits or losses incurred as a result of your investment decisions.
Stay Crypto/Stay Safe
Please like/tip, comment and share.
Support me
- Eth wallet: 0x814a678F3E45CE9A192fCA971F8E3fAea3B5019F
- BTC Wallet: 18eTVpeNWEhjF9d5PGpePn9tseFKzvTxp5
- LTC Wallet: LPoBEUxDw1nCkCgHmzN3PF5XhwRGJ2BYaN
- BCH Wallet: bitcoincash:qzfzn2090xzdpe7463c59lj29wwsn4apqgnyzuf5zv
- Wax Wallet: yftqu.wam
Follow me
- Publish0x: https://www.publish0x.com/@LeaderIcarus
- LBRY: https://odysee.com/$/invite/@LeaderIcarus:a
If you want to register on publish0x consider using this link https://www.publish0x.com/@LeaderIcarus
If you want to trade on Binance with a 5% discount consider register with this https://www.binance.com/en/register?ref=RFCDTZ1B
https://twitter.com/icarusleader
https://hive.blog/@leadericarus