

Bitcoin may consolidate for a few more days, but certain altcoins have created reversal patterns that could lead to a trending move.
Investors are concerned about the stability of the cryptocurrency market after facing negative news in the past few days.
Fortunately, the markets have matured to the extent that negative news no longer caused wild price fluctuations as in the cryptocurrency's early days.
The current stability shows that institutional investors do not see the recent KuCoin hack, accusations of CFTC and DOJ against BitMEX, or even the coronavirus diagnosis of President Donald Trump as serious enough to crash the crypto markets.
Therefore, after the news broke out and the open position remained stable, there was no panic liquidation in Bitcoin (BTC) futures.
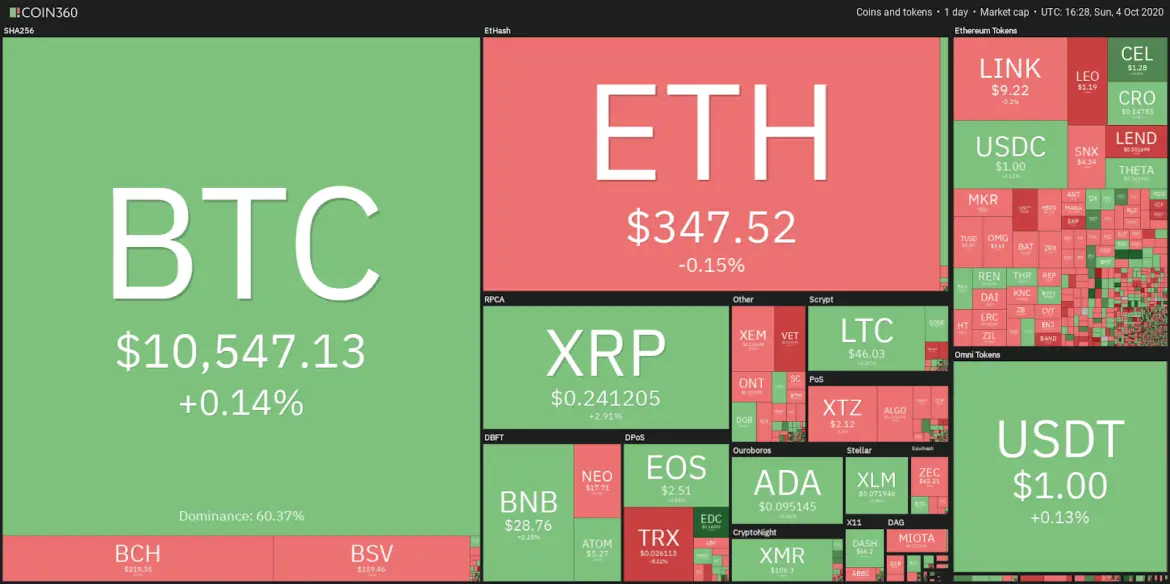
In the uptrend, traders are using price weakness caused by sudden reactions to add to their positions. If Bitcoin remains above the psychologically critical level of $ 10,000, more investors may consider adding to their portfolios.
Despite Bitcoin's horizontal price action, several altcoins have continued their upward trend and others are showing signs of a possible uptrend reversal.
Let's examine the charts of the top 2 cryptocurrencies to see which critical levels could signal the beginning of a trending move.
BTC / USD
The long-term trend in Bitcoin is upward as the 200-day simple moving average ($ 9,448) is rising. However, in the short term, the fixed 20-day exponential moving average ($ 10,682) and the relative strength index near the midpoint suggest a balance between supply and demand.
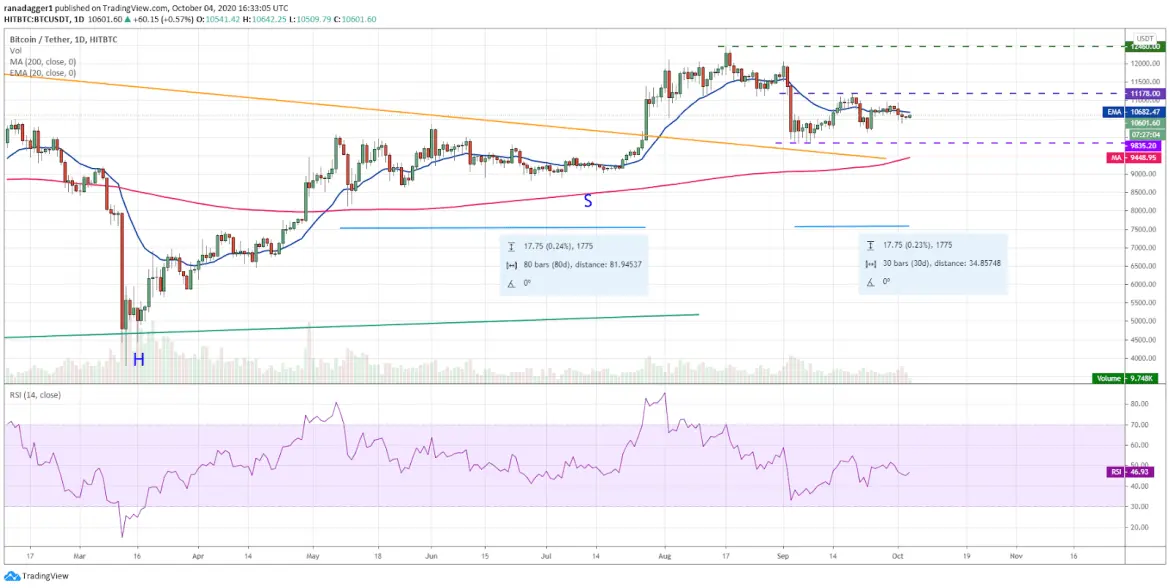
The BTC / USD pair has now been stuck between $ 9,835 and $ 11,178 for the past few days. A break above or below this range can initiate a trending movement.
Between May and July, the pair remained in a narrow range for about 80 days, and the current consolidation completed about 30 days.
If history repeats itself, the price may stay tied to the price range for a few more days. Therefore, traders must be patient until it breaks above or below the price range.
A break at $ 11,178 could initiate a rise with an initial target of $ 12,460, while a break below $ 9,835 and a 200-day SMA could intensify sales as traders rush to exit to clear positions.
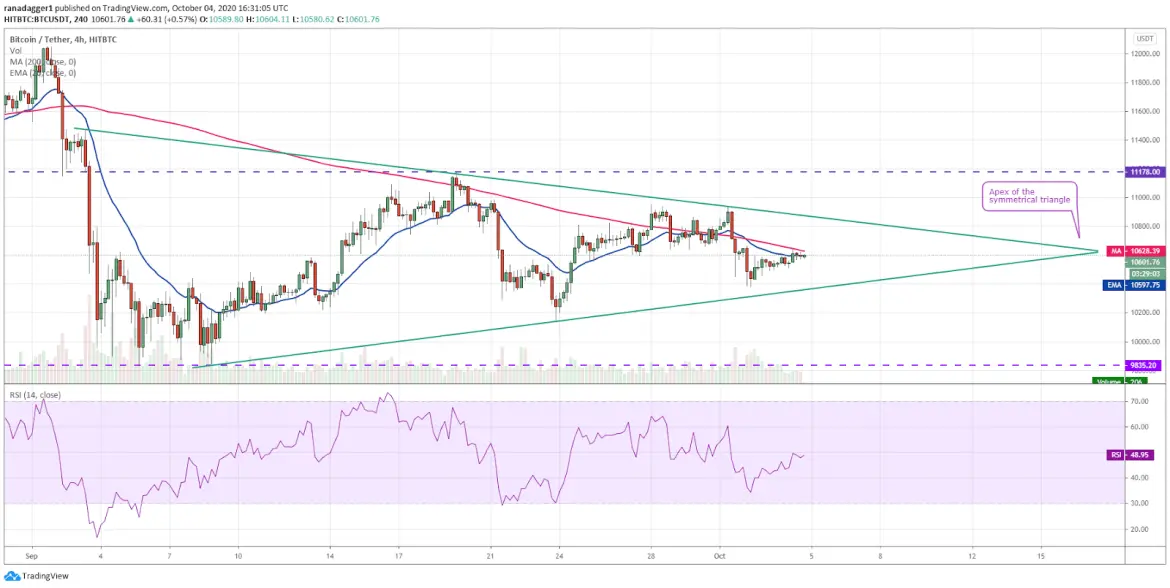
The 4-hour chart shows the price is trading within a large symmetrical triangle. A break between half and three quarters of the distance from the base of the triangle to the apex is considered reliable.
Therefore, bulls and bears may try to break the triangle in the next few days. However, if this does not happen and the price reaches the top of the triangle then the pattern will be considered invalid.
ADA / USD
Cardano (ADA) closed below the 200-day SMA ($ 0.0837) on September 23, but the bears failed to sustain lower levels and the altcoin rose above the long-term moving average on September 24.
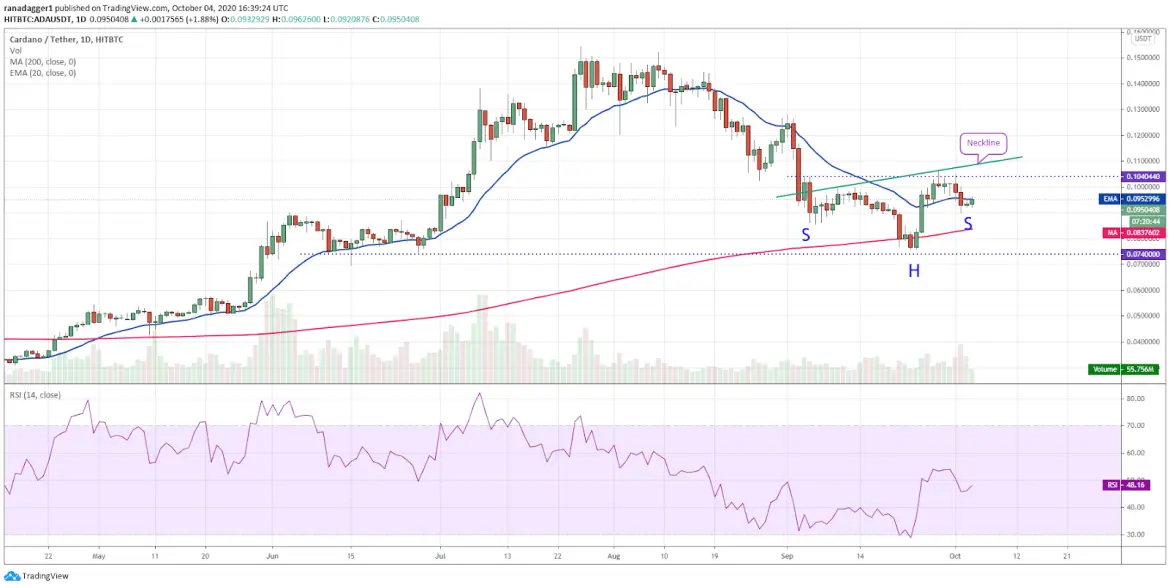
This indicates that the bulls are aggressively defending the 200-day SMA. The price action of the last few days shows a possible reverse head and shoulders pattern formation that will complete and close at a break above the neckline.
The pattern target for this setup is $ 0.1331. This bullish view will only come into play after the price breaks out of the neckline.
Contrary to this assumption, if the ADA / USD rate falls from the current level or neckline and falls below the 200-day SMA, it will invalidate the pattern. This could drive the aggressive sale with the next support $ 0.050.
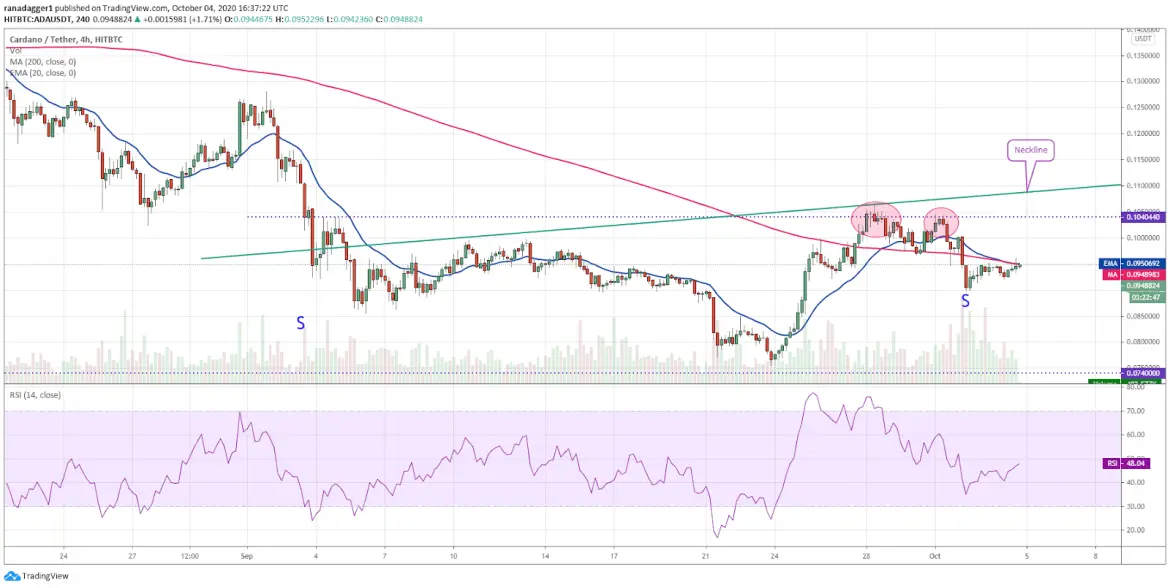
The 4-hour chart shows that the bulls are struggling to push the price above the overall resistance of $ 0.1040440. This shows that the bears are selling at aid rallies for this resistance.
Downward moving averages and the RSI in the negative zone show that the bears have a slight advantage in the short term. If the price breaks below $ 0.0898, the bears will try to lower the price from $ 0.074 to critical support.
Conversely, if the bulls can push the price above the moving averages and sustain it, it is possible to move to $ 0.1040440 and then the neckline.
XMR / USD
Monero (XMR) climbed above the overall resistance of $ 97.70 on September 29, and the retest of the breakout level was successful on October 2. This suggests that the level, which previously acted as a hard resistance, is now acting as a strong support.
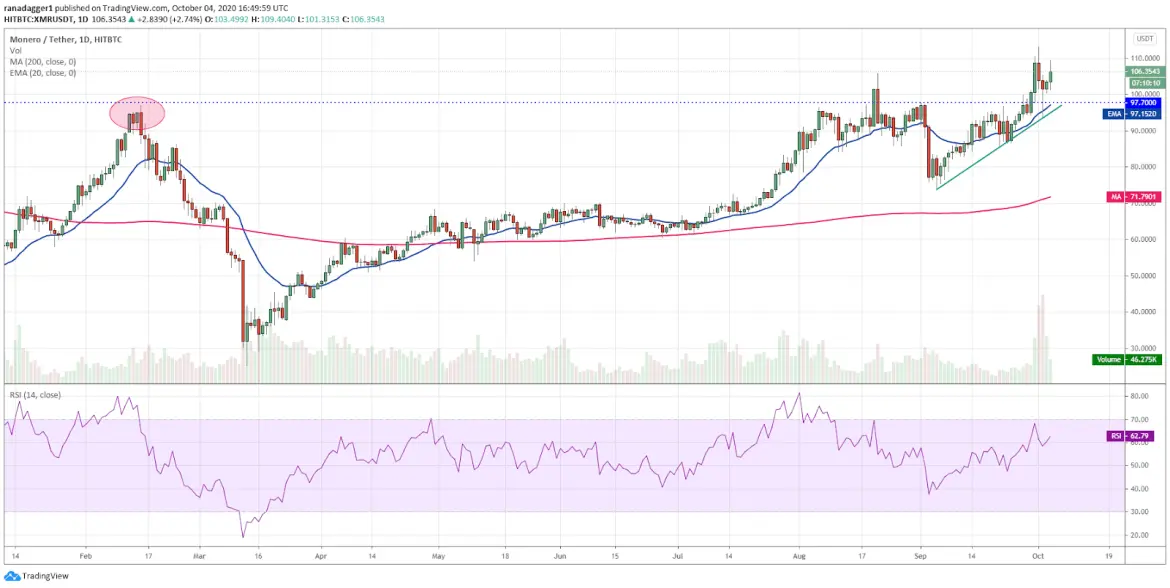
The rising 20-day EMA ($ 97.15) and the RSI in the positive zone suggest the path of least resistance is up. The initial target is $ 113,211 and above it $ 121,427.
If the bulls can push the price above this level and the next target is at $ 140, momentum is likely to increase.
If the XMR / USD rate drops from current levels and drops below $ 93, this positive view will be voided. Such a move could pull the price from $ 71.79 to the 200-day SMA.
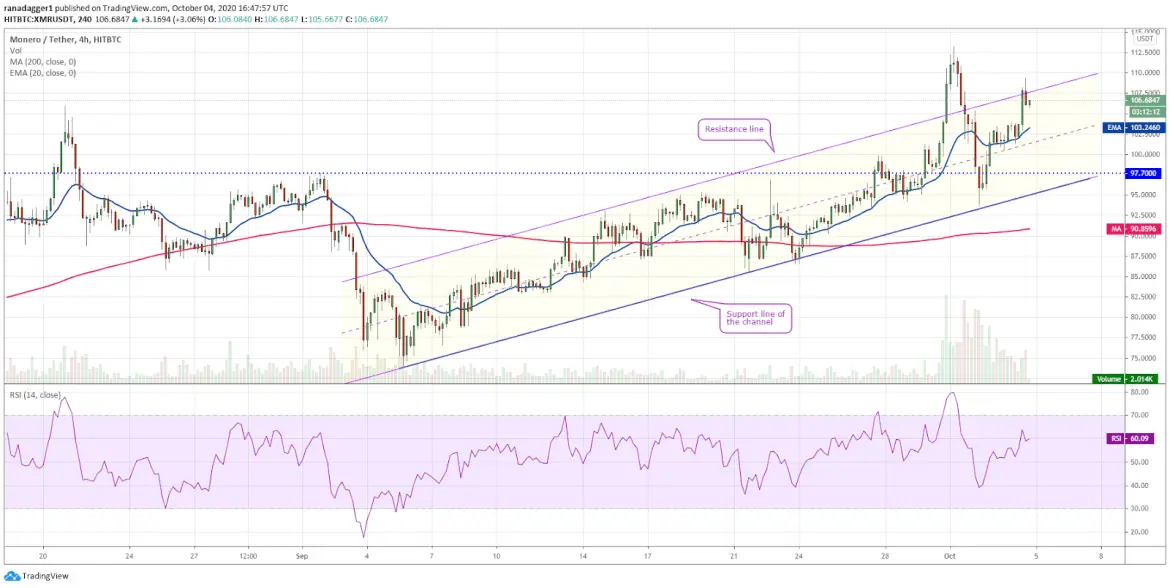
The 4-hour chart shows that the pair has been trading largely within a channel for the past few days. Although the price broke above the channel, the bulls were unable to maintain higher levels and the pair fell into the channel's support line.
However, the recovery from the support line has been strong and the bulls are once again trying to push the price above the channel. If they are successful, the momentum can increase.
Contrary to this assumption, if the price fails to break the channel, then a gradual upward move is likely. The first sign of weakness will be a break below the channel.





