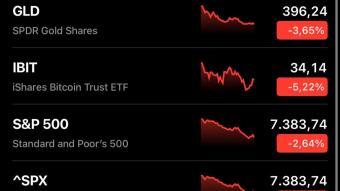
If you've ever stared at a Bitcoin chart at 3 AM wondering, "when the hell should I buy?", welcome to the club. The truth is, nobody really knows what the market will do, but the traders who survive have learned to read certain signals that work more often than a coin toss.
Technical Analysis: Where Everyone Starts (And Many Get Lost)
Most crypto traders live on charts. Not because they're masochists, but because technical analysis, when used well, gives you a framework for making decisions instead of being driven by emotions.
Moving Averages: Every Trader's First Love
Moving averages are like the training wheels of trading. The most classic one? The golden cross: when the 50-day moving average crosses above the 200-day one, Bitcoin has historically tended to pump. The death cross is the opposite and usually precedes rough periods.
Obviously, it doesn't always work, but it's a starting point. Many trading bots use exactly these crosses to open positions automatically.
RSI: The Indicator Everyone Watches (And Therefore Sometimes Lies)
The Relative Strength Index measures whether an asset is "overbought" or "oversold." Above 70? It's probably time to take profits. Below 30? It might be a good time to accumulate.
The problem is that during bull markets, the RSI can stay in the overbought zone for weeks. So, it's never enough on its own; it always needs to be combined with something else.
Support and Resistance: Psychology Made into a Chart
These are the price levels where the market has historically bounced or stalled. If Bitcoin has bounced 5 times at 60k, that becomes an important support zone. If it fails to break above 70k after several attempts, that's resistance.
Big players place massive orders at these levels, so they become self-fulfilling prophecies.
Volume: The Secret Many Ignore
A pump without volume is like a car without gas: it won't go far. If you see Bitcoin rising 10% but the volume is low, it's probably a fake move destined to reverse. Conversely, a breakout with explosive volume has a much higher chance of continuing.
Japanese Candlesticks: The Art of Reading Market Emotions
Candlestick patterns tell stories. A doji (a candlestick with a small body) after a strong rise? Indecision, possible reversal. A hammer after a dump? Buyers are returning. There are dozens of patterns, but the most reliable ones are those that form at key support or resistance zones.
On-Chain Analysis: The Real Crypto Stuff
This is where crypto trading differs from stocks or forex. You can see what the big holders are doing in real time.
Whale Alert and Wallet Movements
When you see millions of dollars in BTC or ETH moving to exchanges, it often means someone is about to sell. Conversely, funds moving out of exchanges and into cold wallets? Accumulation, a bullish signal.
Obviously, it's not always that simple, but certain movements are too big to ignore.
On-Chain Metrics
Things like the MVRV ratio (Market Value to Realized Value), the Puell Multiple, or the number of active addresses give indications of how overvalued or undervalued the market is. They aren't tools for day trading, but for understanding what phase of the cycle we're in, they're gold.
Funding Rate in Futures
If the funding rate is very high and positive, it means too many people are long with leverage. This is often the perfect setup for a liquidation cascade to the downside. Experienced traders close positions or open shorts when they see extreme funding rates.
Sentiment: What People Say (And What They Do)
Fear & Greed Index
This index measures market emotion from 0 (extreme fear) to 100 (extreme greed). The basic rule? Buy when everyone is fearful, sell when everyone is euphoric. But again, during bull markets, the index can stay in the greed zone for months.
Twitter/X and Crypto Twitter
If you see even your aunt starting to ask how to buy Shiba Inu, we're probably near the top. When instead no one is talking about crypto anymore and your friends make fun of you for losing money, that's the time to accumulate.
Google Trends
Google searches for "buy bitcoin" or "altcoin season" are a powerful leading indicator. Search peaks often coincide with local tops.
Risk Management: The Difference Between Who Survives and Who Disappears
You can be right 9 times out of 10, but if you lose everything on that 10%, you've still lost. That's why real traders are obsessed with risk management.
Stop Loss: Life Insurance
Always set a stop loss. Always. Decide before entering how much you're willing to lose (usually 2-5% of your capital) and set the stop at that level. Never move it lower when the price goes against you. Never.
Position Sizing
Never put more than 5-10% of your capital on a single trade, unless you're a degen and you like the thrill of overnight liquidations.
Staged Take Profit: Better to Exit Too Early Than Too Late
When you're in profit, scale out of the position. Take 50% at the first target, 30% at the second, let the remaining 20% run with a trailing stop loss. This way, even if the market reverses, you've still made something.
How to Put the Pieces Together
The truth is, there is no "perfect signal." Traders who consistently profit use multiple tools together:
-
They look at charts for timing (technical analysis)
-
They check on-chain metrics for context
-
They keep an eye on sentiment to understand where the masses are
-
They use risk management to avoid being wiped out when they're wrong
A practical example? Bitcoin breaks a major resistance level with high volume, the funding rate is neutral or slightly negative, whales are accumulating, the Fear & Greed index is below 50. That's a decent bullish setup. Not guaranteed, but decent.
Some Final Advice From Someone Who's Been Through It
Don't try to learn everything at once. Choose 2-3 indicators, study them well, test them. Keep a trading journal where you note why you opened a position and how it went. In 6 months, reread that journal and you'll understand your recurring mistakes.
And above all: accept that you will lose money. Everyone loses trades. The goal isn't to always be right, but to make more than you lose over the long term.
Oh, and if someone on Telegram tells you they have a "foolproof" signal with 90% accuracy, block them and move on.