
Solana (SOL) remains one of the most watched assets by the crypto community, despite trading within a narrow range for several weeks. Unlike Bitcoin and Ethereum, which have seen bullish extensions in April, SOL has failed to break out. Currently trading at 85.57 USDT, it shows a modest +2.50% gain for April, while its Year-To-Date (YTD) performance remains significantly negative at -31.35%. Despite this price stagnation, on-chain metrics remain robust, with numerous ecosystem tokens significantly outperforming the underlying asset this month.
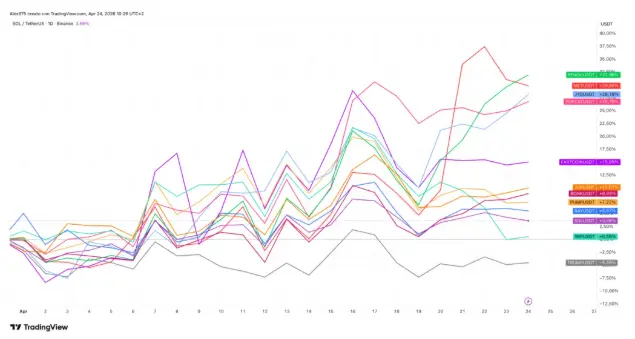
Solana Ecosystem: April Winners vs. 2026 Reality
The overview of Solana-based tokens in April highlights a strong rally for Pudgy Penguins (+32%) and Meteora (+30%), followed by Jito (JTO) at +27.40%. SOL sits at the bottom of the gainers' list, while Official Trump and Dogwifhat are among the worst performers. However, the Year-To-Date (YTD) perspective remains bearish across the board. PENGU (-1.30%) and Pump.fun (-6%) show the highest resilience, whereas SOL is down -31.30% since the start of 2026. Official Trump remains the worst performer YTD with a -40% decline.
Solana Weekly Analysis: Seeking a Bottom
The weekly chart illustrates SOL’s prolonged congestion phase following its last major peak at 253 USDT in September. Since that high, a corrective trend pushed the price down to test the historical support zone between 120 and 127 USDT during late November and December.
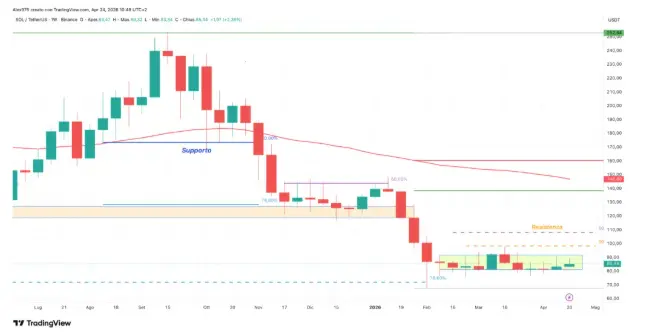
In January 2026, Solana broke below its primary support, crashing to a low of 67.50 USDT. Since then, the price has entered a consolidation phase, trading within a yellow box range for approximately two months. A breakout attempt in March failed, with price quickly returning inside the box. Currently, SOL is trading in the middle of this range, facing its first vector resistance at 98 USDT (the 38.2% Fibonacci retracement of the annual high-to-low move). The primary resistance stands higher at 110 USDT.
Short-Term Outlook: Support at 83.40 USDT
On the daily chart, the focus remains on the current congestion area. SOL has immediate short-term support at 83.40 USDT. A breakdown below this level could push the price back toward the lower boundary of the consolidation box.
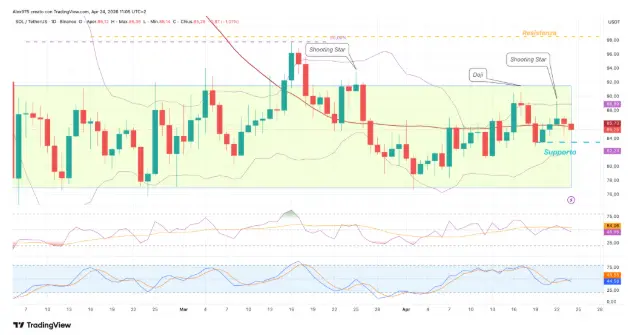
On the daily chart, SOL is in a contraction phase following a Shooting Star candle two days ago—a classic bearish reversal signal. This follows a recurring pattern of similar candlestick formations that previously led to price corrections. Momentum indicators provide little clarity: the RSI is currently tilting downward, confirming indecision, while the Stochastic oscillator remains in neutral territory. Furthermore, the Bollinger Bands are narrowing, indicating a volatility squeeze, although they currently lack a clear directional signal—unlike last week, when a Doji outside the bands reinforced the reversal thesis.





