
The drafting criteria for this analysis are based on three main guidelines:
Technical Analysis: Based on historical price and volume data to identify trends and patterns. Includes the use of trend, momentum, and volatility indicators.
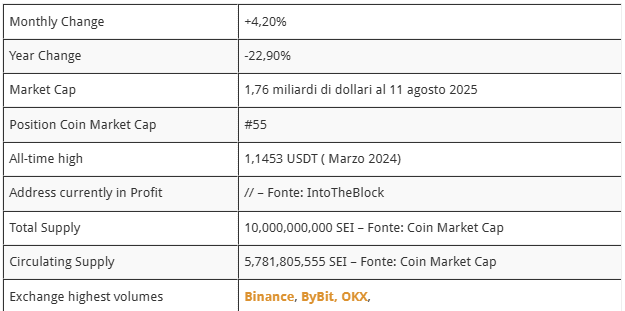
Fundamental Analysis: Assesses factors influencing the intrinsic value of a cryptocurrency, such as market capitalization, circulating and total supply, size of the community, leadership team, listings on top-tier crypto exchanges, and partnerships with reputable institutions.
Sentiment Analysis: Measures market sentiment through activity on social media and news coverage.
SEI Token Overview
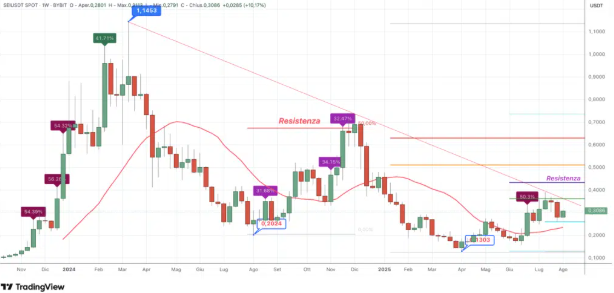
The $SEI token was listed in summer 2023 and reached its all-time high (ATH) of 1.1453 USDT in March 2024, fueled by a rally that began in November 2023. After the peak, a sharp correction followed, culminating in August 2024 with a low of 0.2024 USDT. From that level, a recovery began, reaching 0.7135 USDT in November 2024.
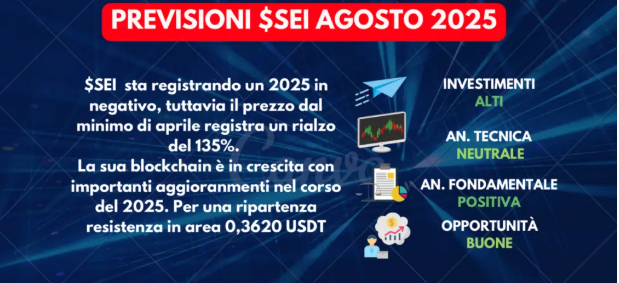
The rally peaked in November, followed by a steady decline over the first four months of 2025, hitting the yearly low in April at 0.1303 USDT. Since then, a series of bullish swings has produced a +135% gain from the low, but the move stalled in mid-July at resistance around 0.3630 USDT, with the main long-term resistance at 0.4350 USDT.
Technical Analysis
-
Short-term: The declining SMA50 signals loss of direction, with MACD and Aroon negative and ROC weak. However, RSI, Stochastic, and CCI indicate increasing bullish pressure with a reversal after the drop.
-
Weekly timeframe: SMA50 and ADX are rising, along with positive MACD, Aroon, RSI, and ROC, suggesting a stronger trend, although declining Stochastic and CCI hint at possible consolidation.
-
Monthly timeframe: Lateral RSI and rising Stochastic point to potential accumulation, but negative ROC and weak Aroon highlight long-term fragility. The first significant resistance remains at 0.3630 USDT.
Current SEI Scenario
SEI’s price trend in 2025 remains in a bearish phase, with a -21% drop year-to-date. After a steep correction, the price has entered a rebound phase from the April low at 0.13 USDT, gaining around +138%. To resume a bullish trend, the price must break through a series of resistance levels.
Historical Performance
-
Summer 2023: SEI listed on exchanges.
-
Nov 2023 – Mar 2024: Strong rally to ATH at 1.1453 USDT.
-
Aug 2024: Deep correction to 0.2024 USDT.
-
Nov 2024: Recovery to 0.7135 USDT.
-
Apr 2025: Yearly low at 0.1303 USDT, breaking previous August 2024 low.
-
Mid-July 2025: Stalled at resistance of 0.3630 USDT.
-
Main vector resistance: 0.4350 USDT (from Dec high to Apr low).


