
The current global macroeconomic landscape is the most complex in recent history. The simultaneous escalation of two major conflicts—the war in Ukraine and the conflict between the United States and Iran (erupted on February 28th)—has shattered global energy and logistical balances. The blockade of the Strait of Hormuz remains the critical pain point, disrupting a primary artery for global oil and gas supplies.
Market Paradox: All-Time Highs Amidst Turmoil
Despite this instability, global equity indices are hitting unprecedented records. The Nasdaq, S&P 500, Nikkei (Japan), and KOSPI (Korea) are all trading at all-time highs. Parallel to this, the crypto market has staged a significant rebound in April, with Bitcoin trending toward the $80,000 USDT mark, signaling a decoupling from traditional geopolitical fear-gauges.
Buying to the Sound of Cannons: The Debt Trap
Despite the euphoria in financial markets, the structural issue of U.S. borrowing costs remains the 'elephant in the room' (the convitato di pietra). The U.S. federal debt is rapidly accelerating toward $39 trillion, while inflation has begun to tick upward again. This combination is creating a 'higher-for-longer' interest rate environment that challenges the sustainability of the current equity rally.
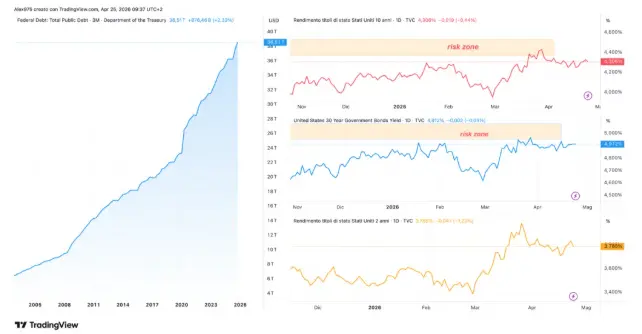
The $39 Trillion Trajectory
The U.S. National Debt currently stands at $38.51 trillion, reflecting a quarterly increase of $876 billion (+2.33%). The stock is growing at an alarming rate of $1 trillion every 100 days. Projections for 2026 indicate that Treasury issuances will reach an average of $1 trillion per month, split between refinancing existing debt and funding new deficits. Notably, interest payments now consume 18% of federal revenue—nearly double the 9-10% ratio seen in Italy, despite the latter's higher debt-to-GDP ratio.
Inflation and the Geopolitical Energy Shock
The March CPI (Consumer Price Index) in the U.S. surged to 3.3% annually, up from 2.4% in February. The month-over-month increase of 0.9% marks the steepest jump since June 2022. This spike is almost entirely driven by energy costs: the conflict with Iran has pushed gasoline prices up by 21.2% in a single month, the highest monthly record since 1967.
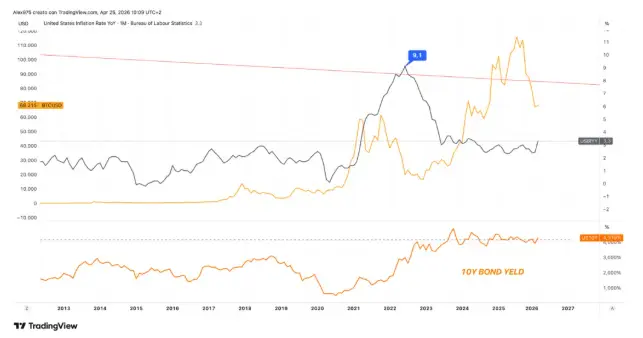
While the headline CPI is surging due to energy shocks, the Core CPI remains anchored at 2.6%. This suggests that underlying structural inflation is not yet compromised, providing the Federal Reserve with the necessary 'policy space' to consider rate cuts despite the geopolitical turmoil.
Technical Signal: The Bull Steepening of the Curve
The most critical technical signal is emerging from the Yield Curve. We are witnessing a Bull Steepening: the 2-year yield (US02Y) has dropped to 3.785% (-1.23%), while the 10-year yield (US10Y) remains stable at 4.306%. This has pushed the 10Y-2Y spread to +52 bps. In bond market parlance, this indicates a rally in prices on the short end (lower yields), meaning the market is aggressively pricing in Fed cuts. However, the stability of the long end shows that investors still demand a high term premium to compensate for persistent inflation and the massive supply of federal debt.
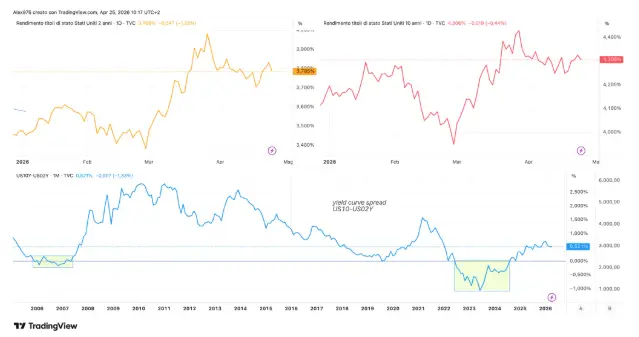
Historically, a bull steepening of the yield curve has been the final warning before a major recession, as seen in 2000-2001 and 2007-2008. Typically, the transition from inversion to recession takes 4 to 12 months. Today, we are approximately 19 months out from the last negative reading of September 2024. While the cyclical deterioration has taken longer to materialize than in past decades, the widening spread remains a primary concern for asset stability.
Fiscal Dominance and the 30-Year Thermometer
The divergence between short and long-term yields highlights a fiscal dominance trap. While the market expects the Fed to cut rates for cyclical support, the sheer volume of federal debt demands a high-term premium on the long end. The 30-year Treasury (US30Y) at 4.91% serves as the ultimate thermometer of this pressure: if the Fed cuts to stimulate growth, it risks fueling structural inflation; if it stays hawkish, it risks a fiscal collapse due to debt servicing costs.
The Global Link: Japan’s Carry Trade Risk
The Bank of Japan (BoJ) faces an identical dilemma: Core CPI at 2.4% and a debt-to-GDP ratio of 250%. Any aggressive move to raise rates to defend the Yen would trigger a violent unwinding of the global carry trade, leading to massive sell-offs in global equity markets, including the S&P 500 and Nasdaq.
Bitcoin: The Unprecedented Macro Test
For Bitcoin, this represents its first true 'Macro Trial.' Unlike the 2020 pandemic shock, which was a localized liquidity event followed by massive printing, a 2000/2008-style recession during a bull steepening is a scenario BTC has never faced. The digital asset must now prove if it acts as a risk-on proxy or a genuine hedge against sovereign fiscal failure.
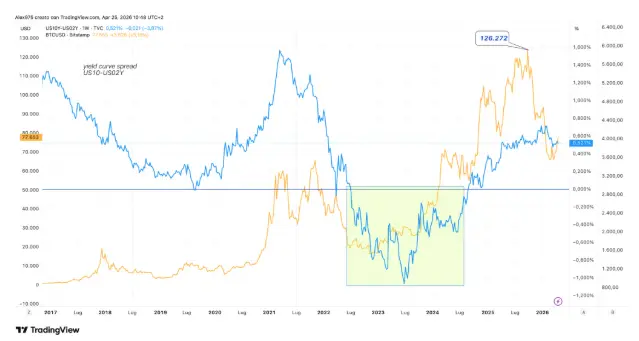
The current correction from the All-Time High of $126,272 USDT to the present $77,000 mirrors the 2018-2019 pattern when Bitcoin plummeted from $20k to $3.2k before recovering. However, the structural landscape of 2026 is fundamentally different. The market is now underpinned by Spot ETFs, massive corporate holdings led by MicroStrategy, and a newfound level of regulatory recognition. These 'Diamond Hands' institutions create a liquidity floor that did not exist in previous cycles.






