
Wall Street Hits Historic Milestones
Global financial markets and the crypto ecosystem concluded April 2026 with a powerful rally. On April 30, both the Nasdaq and the S&P 500 achieved new All-Time Highs (ATHs). The monthly closes for these indices are the strongest recorded since April 2020, echoing the historic post-Covid recovery phase.
Crypto Market: Stability Amidst the Surge
The cryptocurrency market mirrored this positive sentiment, albeit with more measured gains on the final day of the month. Bitcoin (BTC) closed the day up +0.73%, while Ethereum (ETH) saw a more modest increase of +0.20%. These positive closes solidify a month of consolidation and growth across the digital asset space.
Wall Street Hits Record Highs While Crypto Momentum Slows
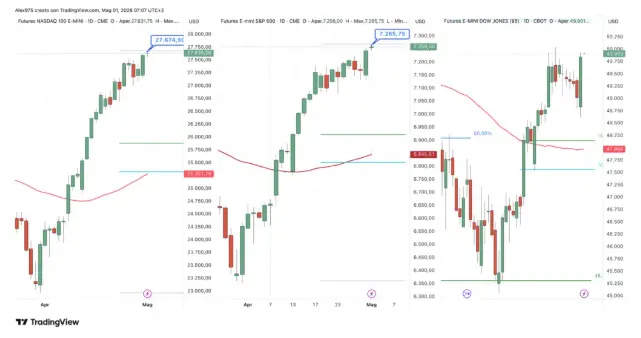
U.S. stock markets concluded April 30, 2026, at new All-Time Highs, confirming a powerful bullish trend. In overnight trading, S&P 500 futures continued to push higher, while the Nasdaq reached a staggering 27,674.50 points, fueled by the explosion of AI-related and tech stocks. The Nasdaq's April performance of +15.39% is its best monthly showing since the historic recovery of April 2020.
Market Sentiment and the VIX
In contrast, the Dow Jones Industrial Average lagged behind, failing to secure new records. Interestingly, despite the market highs, the VIX (Volatility Index) remains relatively elevated at 17 points, suggesting a lingering sense of caution among traders. While European markets are closed today, May 1st, for the holiday, U.S. markets remain open for regular trading.
Crypto Performance: Zcash Leads, BTC Gains +11.80%
The crypto ecosystem also closed April in positive territory, though it struggled to match the velocity of the tech-heavy Nasdaq. Bitcoin (BTC) ended the month with a solid +11.80% gain. The surprise leader of the month was Zcash (ZEC), which outperformed most tokens. While the AI boom serves as a primary driver for equities, its direct impact on crypto prices remains theoretical for now, leading to a more 'braked' performance in digital assets.
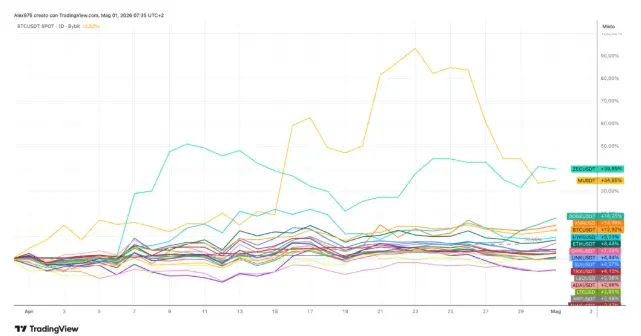
Among the current top 20 tokens by market capitalization, Zcash (ZEC) emerged as the top performer for April with a +40% surge. It was followed by MemeCore with a +36% gain and Dogecoin (DOGE) at +18%. Bitcoin (BTC) recorded a solid +11.80% increase, marking its best monthly performance since April 2025, when it closed up +14.11%.
The Laggards: Negative Monthly Closes
Despite the broader market rally, not all major assets ended the month in the green. Bitcoin Cash (BCH) was the worst performer among the leaders, dropping -5.40%, preceded by Stellar (XLM) which saw a decline of -4.80%.
Current Price Action: Bitcoin Approaching Resistance
As of May 1st, Bitcoin is trading at 77,100 USDT, showing positive daily momentum. However, on a weekly timeframe, the asset remains in a slight contraction, down -2% as it attempts to break through key overhead resistance levels.
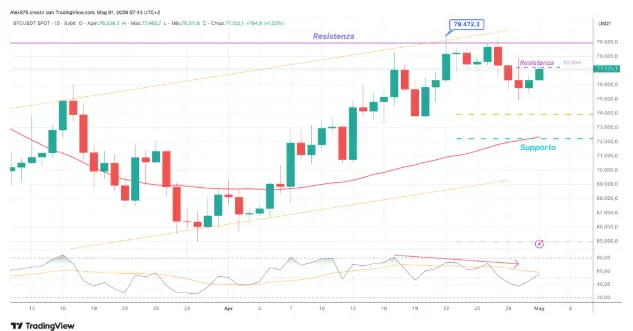
On the daily chart, Bitcoin is approaching a critical short-term resistance area at 77,200 USDT. A daily candle close above this level is essential to confirm the continuation of the bullish leg that began in late March.
-
Primary Resistance: The ultimate goal remains a breakout above 79,000 USDT, specifically closing above the relative high of 79,472 USDT.
-
Key Support: On the downside, the first significant support level is established at 74,000 USDT.
-
Momentum Indicators: The RSI (Relative Strength Index) is trending upward and is currently crossing its moving average, signaling growing bullish momentum.
Ethereum (ETH): Bouncing Off Support at $2,260
Ethereum is currently trading at 2,384 USDT, showing greater relative weakness than Bitcoin with a weekly contraction of -3.56%.
-
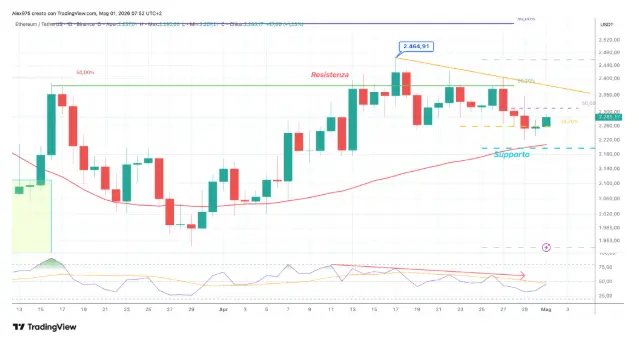
Support Test: ETH recently tested the 2,260 USDT support level, consolidating there for three days and hitting a daily low of 2,221 USDT.
-
Market Outlook: While BTC eyes new highs, ETH remains in a defensive posture, relying on its current support to prevent further slides.
The Bearish Structure
The current weakness in Ethereum is highlighted by a consistent series of lower highs and lower lows that has been in place since April 17th. To signal a genuine trend reversal and confirm the strength of the current bounce, ETH must overcome its first vector resistance at 2,315 USDT. A daily close above this level is critical to shifting market sentiment.
Key Support and the 50-Day SMA
On the downside, since ETH has already breached its initial vector support, the focus shifts to the primary support zone at 2,200 USDT. This area is of vital importance as it intersects with the 50-day Simple Moving Average (SMA 50), creating a strong confluence of technical defense. A break below this could signal deeper corrections.






