![Pudgy Penguins : Price $PENGU [2026/2027]](https://www.publish0x.com/img/1173130.webp?action=resize&ar=1&enc=webp&inv=0&ori=1&st=1&up=1&w=1140&signature=2d87a50cccd4e772fc138b069617572112ea4b41632623709689addd9f03d15e)
Pudgy Penguins (PENGU) Price Outlook: Technical Recovery and On-Chain Growth
Forecasts for Pudgy Penguins (PENGU) indicate that the token is in a short-term rebound phase this April, following months of significant contraction. This predictive analysis combines technical indicators and on-chain metrics to provide potential medium and long-term scenarios. While the token remains below its historical peaks, recent ecosystem developments—such as the launch of the Pengu Card and the expansion of Abstract Chain—are driving a fundamental recovery in price action.
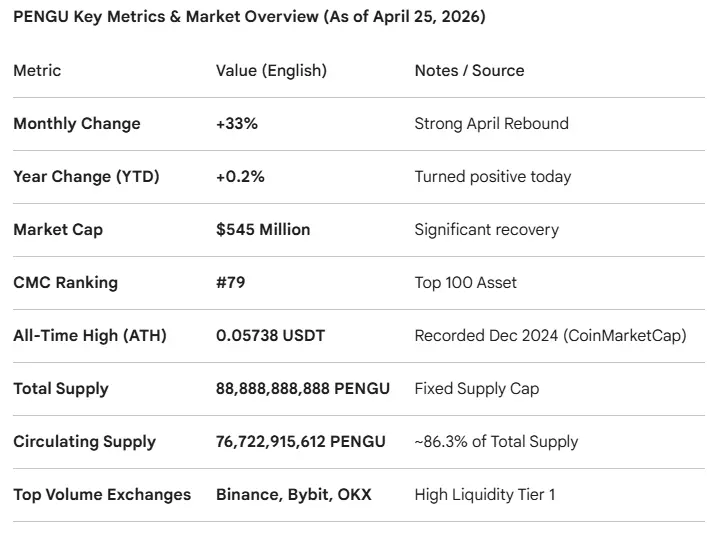
Listed on major exchanges in December 2024, PENGU initially surged to an all-time high (ATH) near 0.065 USDT on Bitget. This peak was followed by a sharp 91% correction, hitting a low of 0.00372 USDT in April. A significant rebound occurred in July (+128%), fueled by the Pudgy Penguins mascot’s appearance at the Nasdaq opening ceremony and speculation regarding a PENGU ETF filed by Canary Capital. Despite a year-end decline of -74%, 2026 has seen a recovery after a February low of 0.005282 USDT. PENGU has now established a base at 0.0063 USDT, with April turning positive and the price neutral for the year. Key resistances are set at 0.00845 USDT and a major target at 0.015 USDT.
Current Scenario: The Rise of Pudgy Penguins (PENGU)
Born as an Ethereum NFT collection in July 2021, Pudgy Penguins underwent a strategic relaunch in 2022 under Luca Netz, evolving into a global brand that bridges digital assets with physical merchandising. The PENGU token, launched on Solana on December 17, 2024, serves as the ecosystem's native currency. Following a challenging 2025 with a -74% year-end decline, the token’s performance in 2026 is currently neutral, sustained by the significant rebound recorded in April.
The Price History of Pudgy Penguins (PENGU)
$PENGU was listed on major exchanges in December 2024, giving it an eight-month trading history. Since its debut, it experienced a massive bullish surge, hitting its All-Time High (ATH) almost immediately. While CoinMarketCap records an ATH of 0.05738 USDT, the weekly chart on Bitget shows a peak of 0.065 USDT. Such discrepancies between exchanges are common for low-cap tokens during their initial listing phase due to extreme volatility and liquidity fragmentation.
Historical Price Action and Key Recovery Levels
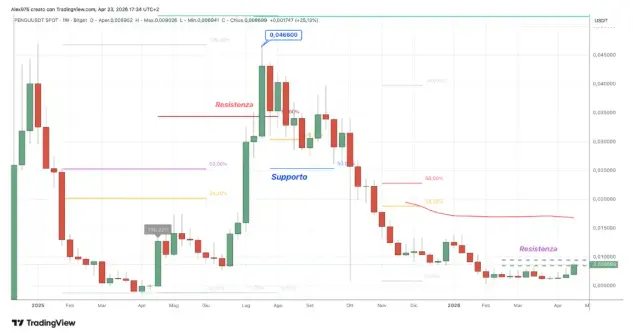
Following the initial surge in January 2025, PENGU entered a bearish phase, hitting an annual low in April at 0.00372 USDT—a 91% drop from its Bitget ATH. This level acted as a definitive floor, remaining untouched even during the October flash crash. A powerful rebound ensued, culminating in a +128% gain in July, fueled by speculative rumors of a PENGU ETF filed by Canary Capital, which sparked initial institutional interest. After peaking at 0.0466 USDT in July, the price entered a contraction, closing 2025 with a -74% loss. The start of 2026 saw five consecutive red weeks, bottoming out in February at 0.005282 USDT. Since then, PENGU established a support base at 0.0063 USDT, accelerating over the last two weeks toward short-term resistance. The primary vector resistance for a confirmed trend reversal stands at 0.0150 USDT.
Pudgy Penguins Price Forecast and Trend Indicators
The following overview details the price action of $PENGU and its potential evolution, based on a technical setup of trend indicators including Moving Averages, MACD, ADX, and the Aroon Indicator. Please note that Monthly data is currently unavailable as the historical price series is too short to provide relevant technical confirmations, with the exception of the Aroon Indicator.
PENGU Daily & Weekly Setup Analysis
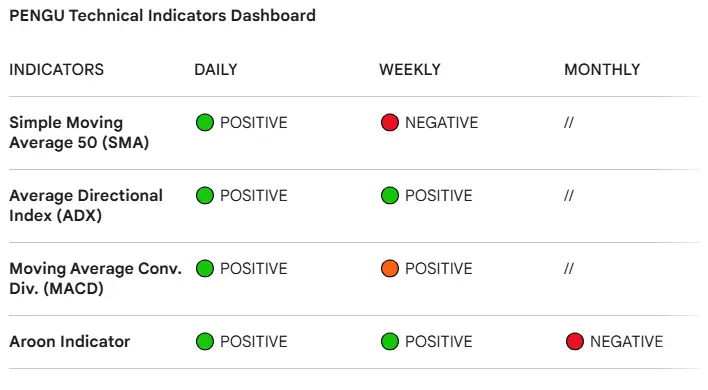
On the daily setup, PENGU’s structure is positive: SMA 50, ADX, and MACD are in bullish territory, and the Aroon is positive. This indicates a solid trend with strong directional force and a favorable technical configuration for continued short-term growth, supported by well-defined buying pressure. On the weekly timeframe, the structure remains mixed: while the SMA 50 is negative, the ADX, MACD, and Aroon are positive. This suggests an improving context that is not yet fully aligned, requiring further confirmation to consolidate a clear medium-term direction.
Pudgy Penguins Price Forecast: Momentum Indicators
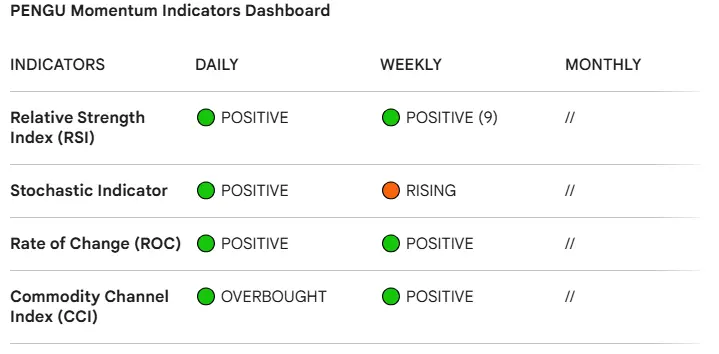
To assess the dominant trend and identify emerging patterns, we analyze key momentum indicators such as the RSI, Stochastic Oscillator, Rate of Change (ROC), and the Commodity Channel Index (CCI). The RSI and Stochastic Oscillator are utilized to identify overbought or oversold conditions; the Stochastic compares the closing price to its range over a specific period, while the RSI measures the speed and change of price movements. Additionally, the CCI identifies price levels relative to their statistical average to detect market cycles, and the ROC measures the percentage change in price to evaluate trend velocity and strength.
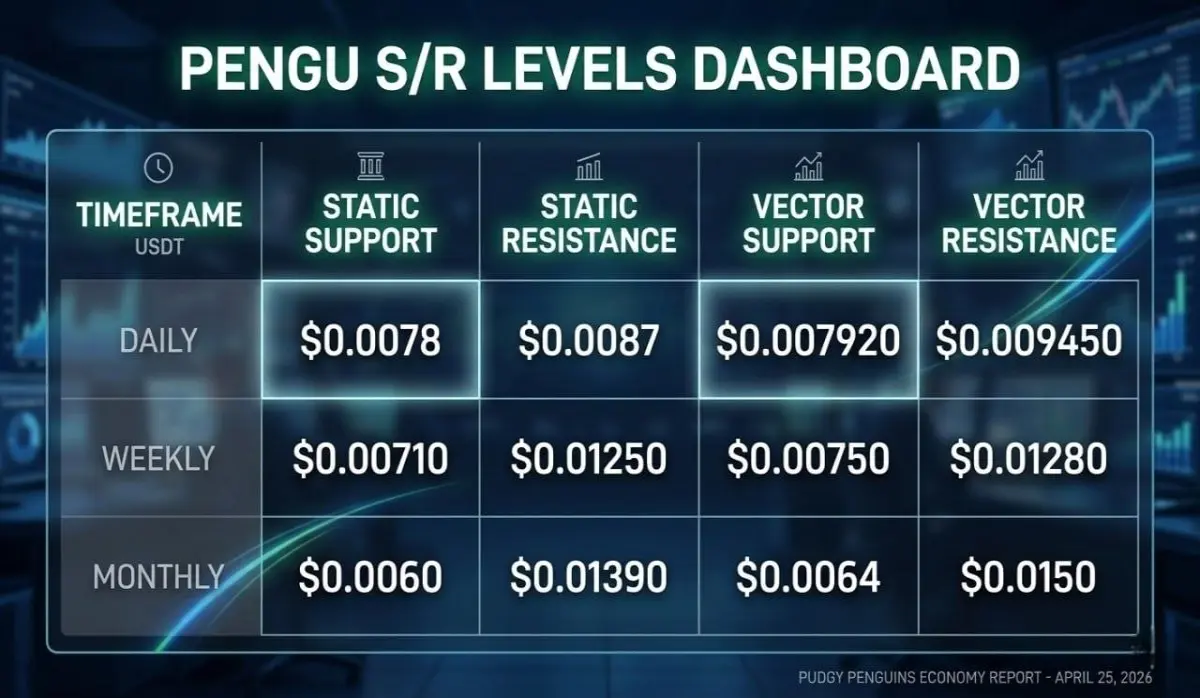
Pudgy Penguins: Updated Support and Resistance Levels
Below is the current scenario for graphical support and resistance levels, categorized into static and vector levels. 'Static levels' are horizontal lines at specific price points that remain constant unless significantly breached (at which point support may flip to resistance and vice-versa). 'Vector levels' are derived through the application of Fibonacci retracements, identifying mathematical zones of interest based on the asset's price swings.
Pudgy Penguins Volatility Indicators
We assess the volatility scenario for cryptocurrency through two primary indicators: Bollinger Bands (BB) and the Average True Range (ATR). Bollinger Bands provide insights into relative volatility and potential price extremes (overbought or oversold), while highlighting potential breakout opportunities during periods of low volatility. Our BB classification ranges from low and decreasing to increasing and high. Conversely, the ATR offers an absolute measurement of price volatility without indicating direction, making it a vital tool for risk management and setting stop-loss levels.
Volatility Analysis: Bollinger Bands & ATR
Volatility measured by Bollinger Bands continues to show a strong bullish scenario on the daily chart. After a period of 'squeezing,' the price is currently trading above the Upper Bollinger Band in overbought territory, a move confirmed by the surging ATR (Average True Range). Conversely, on the weekly chart, the bands are beginning to contract following weeks of high volatility, while the price has successfully crossed above the Median Band. The ATR on the weekly timeframe is decreasing, though the pace of this decline is slowing down.
Fundamental Analysis & Ecosystem Expansion
Launched in 2021 as a collection of 8,888 NFTs on Ethereum, Pudgy Penguins has evolved into one of the most recognizable Web3 brands. While the PENGU token debuted as an ERC-20 asset to maintain consistency with its origins, the ecosystem expanded to Solana in December 2024 to leverage higher speeds and lower fees. Solana now hosts the majority of the token's trading volume. In 2026, the project hit a milestone with the Pengu Card, developed in partnership with Visa and KAST. This utility allows users to spend crypto at over 150 million merchants worldwide, offering cashback and yield—a strategic move to bridge Web2 and Web3 through real-world retail adoption.
On-Chain Data & Holder Concentration
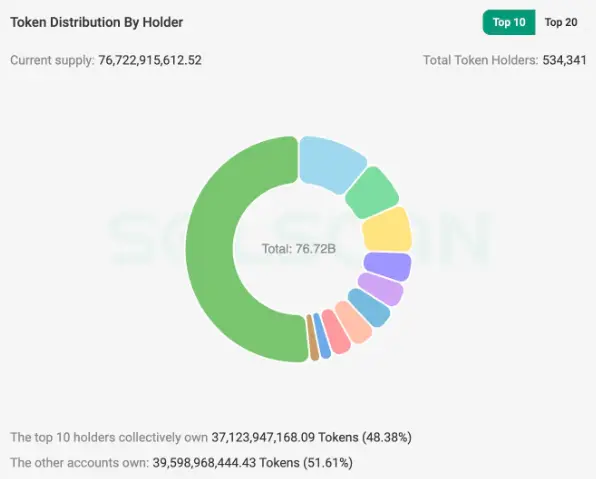
As of mid-2025/early-2026, the circulating supply stands at approximately 76,722,915,612 PENGU. On-chain data reveals high concentration, with the top 10 holders controlling 48% of the circulating supply. The largest single address ('GcEXZE...ZJZu') holds 16.30% of the total supply.