
The crypto market reminds us that both volatility and the possibility of declines exist 📉⚡, as Bitcoin (BTC) is also showing this week. Currently, BTC is trading at $115,800 and in August is so far unchanged after testing yesterday’s low of $111,655. Powell’s words yesterday at Jackson Hole helped the markets 🎙️📊, with BTC closing up +3.93% and the S&P 500 up +1.49%.
📊 Long-term overview of Bitcoin

At present, Bitcoin is logging four consecutive green months ✅, and to know if August will be the fifth, we’ll need to wait for the monthly close. In the attached monthly chart, we can see a contraction phase: compared to the August 14th ATH at $124,517, BTC is down about -6.30%.
Looking at this chart, the uptrend Bitcoin has been in since early 2023 is clear 🚀. Over the last 31 months, BTC shows a growth of +569% 📈.
🛑 Physiological corrections and support levels
Since the beginning of the year, BTC remains largely positive 🔝, so corrections should not surprise anyone — and there’s still no reason for concern.
Corrections, even just on a percentage basis, are plausible after strong rallies. In this chart view, the first medium-term supports are visible:
-
First level: $104,000–105,000
-
Stronger support: $99,500
At the moment, supports below $100,000 are not yet an issue.
📅 Weekly overview of Bitcoin

While there are no concerns for the long term, the medium-short term scenario looks different. The attached weekly chart shows BTC’s performance since early 2025, when it peaked in January at $109,590.
From that level, a correction began, deep enough to bring BTC to the April low of $74,500 😮, before a new bullish leg started, culminating in the new ATH at $124,517.
Focusing on the latest moves, Bitcoin entered another congestion phase after the ATH, until this week when it also broke down the dynamic support trendline (blue line).
📉 Bitcoin exit for weekly setup
In the lower part of the chart, the weekly setup of indicators emerges, which exited the long entry of mid-April around $93–94,000.
📆 Daily scenario of Bitcoin
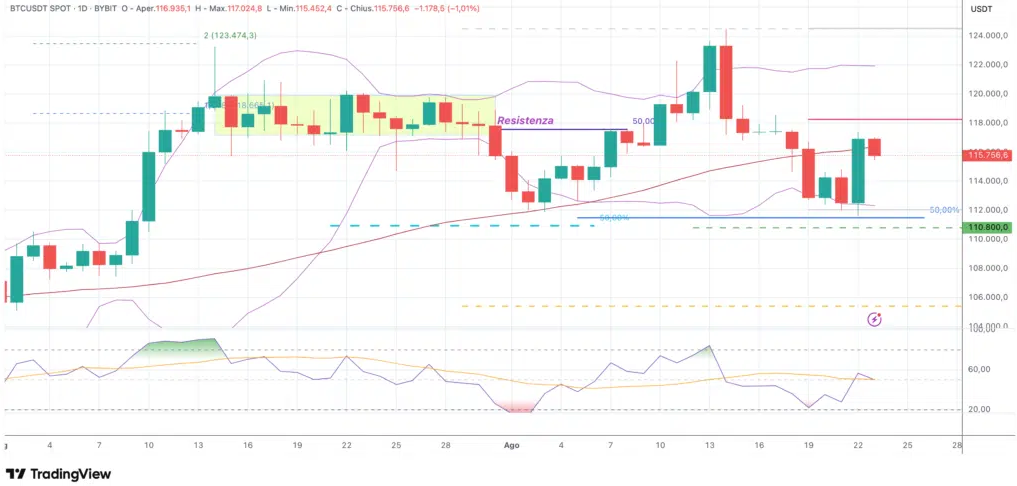
On the daily chart, a clear downtrend is visible after the ATH. Indicators show the fast RSI (5-period) trending down for the last 10 days and almost entering oversold territory yesterday ⚠️. Then came Powell’s speech, triggering a rebound.
⚔️ BTC short-term resistance
Yesterday’s move once again showed BTC’s strength 💪. For this setup to be confirmed, the price now needs to break $118,200.
Only with this breakout can Bitcoin re-enter, even in the short term, the primary long-term uptrend still in place 🚀.


