
MemeCore (M) Rallies +34% in 24 Hours, Targets Top 20
In a crypto market showing some uncertainty despite remaining positive, MemeCore (M) stands out with a +34% rally in the last 24 hours, currently trading at 3.79 USDT. This surge brings April's gains to +60% and its year-to-date performance for 2026 to +140%. With a market capitalization of $4.88 billion, MemeCore is knocking on the door of CoinMarketCap’s Top 20, currently holding the #21 spot in the global ranking.
The +140% Rally: March Hard Fork
The rise was triggered by a chain of events, including the completion of the March Hard Fork, fully activated on March 25, 2026. This update transformed the infrastructure into a highly efficient Layer 1, slashing fees by 100x (from 1500 to 15 gwei) and introducing account abstraction. Today, MemeCore is among the most brilliant tokens in the meme token sector.
MemeCore Flips Litecoin and Shiba Inu
Euphoria in recent days has also been driven by MemeCore overtaking major tokens such as Shiba Inu, which now sits at #28 in the global ranking with a $3.68 billion market cap. The current acceleration has pushed $M above legacy cryptos like Litecoin and Avalanche. Furthermore, 50x leverage perpetual contracts have been launched on Aster.
MemeCore Weekly Overview
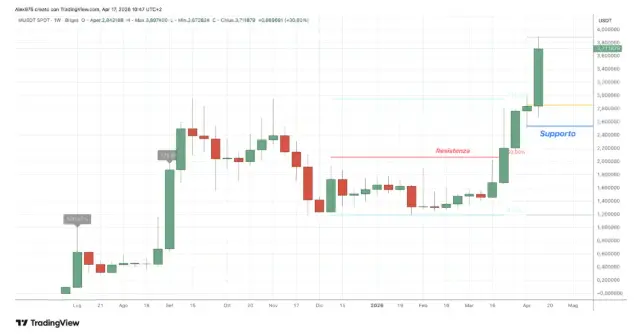
On the weekly chart, we have an overview of M's price action since its launch at the beginning of last summer. After an initial surge, it went through a consolidation phase, with a first bullish acceleration in the summer when it reached 2.99 USDT in September. From there, a contraction phase began, with the October flash crash pushing the price of M to the 1.45 USDT support level.
This was followed by a bounce and a new all-time high at 3.028 USDT, from which the price contraction resumed, also due to the formation of a Shooting Star reversal candle. In December, M touched a minimum in the 1.19 USDT area, marking a -60% loss from the previous ATH.
MemeCore’s New ATH
In 2026, the price of $M started with weakness, falling back to the 1.20 USDT support area, a level that was retested and served as a base. From here, a bounce phase began with an initial breakout of the 2.10 USDT resistance followed by further acceleration. Currently, it is recording its fifth consecutive positive week, which is a first in its short history.
Yesterday, MemeCore registered its new ATH at 3.89 USDT with a +33% increase. In this graphical overview, we also identify the two most relevant medium-term supports, located at 2.86 USDT and in the 2.54 USDT area.
MemeCore Short-Term Scenario
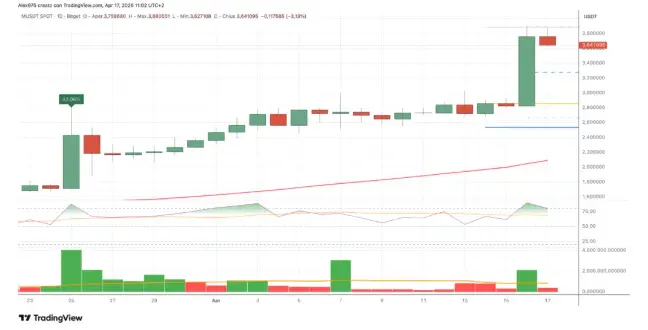
On the daily chart, we show an overview of M's price action since March, highlighting a bullish trend characterized by a series of higher highs and higher lows with consolidation phases. The acceleration already began in late March with a +42.30% daily gain, followed by a consolidation and rise, leading up to yesterday’s surge where trading volume reached 26.6 million, doubling compared to the average session.
Today, MemeCore is recording a contraction of -2.50%. Focusing on the short term, the first support level it must maintain is at 2.35 USDT. At the bottom of the chart, the trading volume indicator clearly shows the recent volume spike. The RSI indicator is also reflecting the strength of the rally, entering the overbought area, which will need to be confirmed at the daily close.






