
Hormuz and Expiring Truce: Crypto Rallies Amid Standoff
The April 22nd truce deadline between Iran and the USA is fast approaching with no significant diplomatic breakthroughs thus far. However, stock markets continue to bet on a potential ceasefire, as does the crypto world, which saw a rebound in Bitcoin and Ethereum yesterday following the weekend’s contraction."
Operational Gridlock in the Strait
On the ground, only a few vessels continue to transit the Strait of Hormuz, while several commercial units have been turned back. The diplomatic front remains fragile, with mutual accusations between Washington and Tehran stalling an agreement. The ceasefire expires at midnight on April 22, 2026, following a 14-day non-renewable truce. Markets are already reacting, with oil prices rising and growing uncertainty over global energy flows.
Oil Rises: WTI and Brent Up, but Still Far from $100
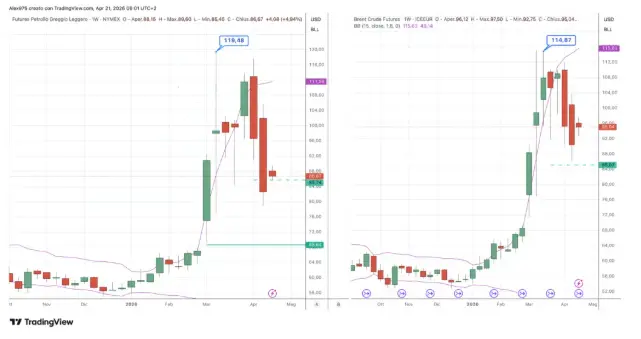
The price of WTI futures closed yesterday with a +5.90% increase, while in overnight trading it remained substantially unchanged at $86.60 per barrel. A nearly identical situation is unfolding for Brent, which closed up +5.65% and is currently trading at $95.10 per barrel at the time of writing.
Nasdaq and S&P 500 Cling to All-Time Highs
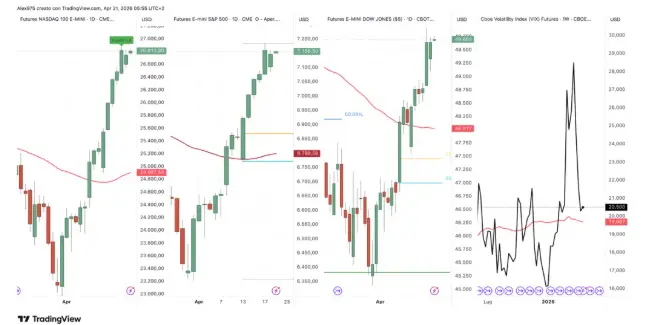
Futures on the S&P 500 and Nasdaq remain pegged to their all-time highs. In overnight trading, they are slightly positive following yesterday's contained contractions. The S&P 500 is recording an +8.94% gain in April; one would have to look back to July 2022 to find a larger monthly rally. This bullish movement is primarily driven by the tech sector, with the Nasdaq snapping a 10-session winning streak yesterday, currently up +12.14% for the month. In April, Amazon leads the charge with a +19% gain, followed by Meta and Google at +17%.
Crypto Rallies in April 2026
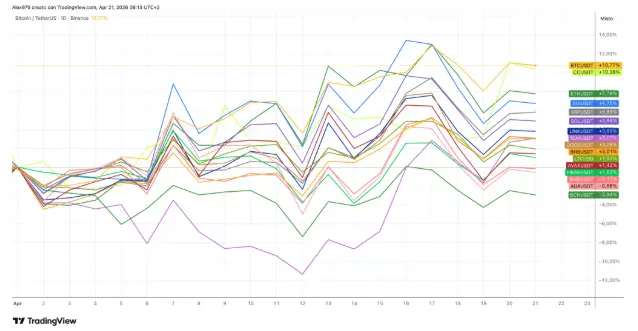
The crypto sector is also trending upward on a monthly basis, as shown in the Top 20 market cap chart. This overview highlights the month's volatility, characterized by a bearish phase followed by last week's sharp bullish acceleration. In recent days, however, a contraction phase has emerged. Currently, Bitcoin is the top performer with a +10.80% gain, followed closely by Canton (CC) at +10.30% and Ethereum at +7.80%. On the negative side, Bitcoin Cash and Cardano continue to underperform.
Bitcoin's Short-Term Technical Scenario
Despite the strong monthly gains for BTC and ETH, both assets have shown signs of uncertainty in recent days with alternating movements. BTC is currently trading at 75,600 USDT. After a -4.30% correction over the weekend and a +2.75% rebound yesterday, it is virtually unchanged today with a slight -0.27% dip at the time of writing. This highlights the ongoing struggle to maintain a consistent trend direction.
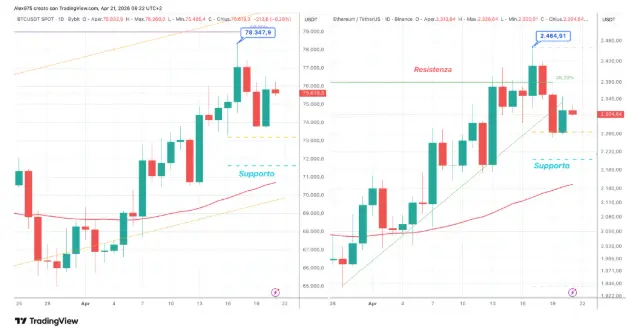
BTC finds its first level of support at 73,200 USDT, while the primary support zone is located further down at 71,600 USDT.
Ethereum Short-Term Technical Scenario
Analyzing the daily chart for Ethereum (ETH), we see a similar pattern. After two days of contraction, it recorded a +2.23% rebound yesterday and is currently trading at 2,300 USDT. ETH’s downward movement was technically cleaner, as it precisely tested the first support level at 2,265 USDT on Sunday before starting its recovery. Meanwhile, the main support remains at the 2,200 USDT area.






