
A Distinctive Performance in a Volatile Month While May is proving to be a highly choppy and volatile month for the broader digital asset market, Humanity Protocol (H) has emerged as a top performer, booking a +40% breakout. This monthly expansion pushes its Year-to-Date (YTD) performance up +50% for 2026.
In an ecosystem heavily dominated by artificial intelligence narratives, Humanity Protocol focuses on human centricity—verifying the uniqueness of real individuals to distinguish genuine users from automated bots and synthetic identities.
Key Institutional Drivers Behind May’s Expansion This sharp upward move does not stem from a single isolated announcement, but rather from the steady integration of major structural updates alongside renewed interest in innovative altcoin architectures.
The primary fundamental catalyst remains the protocol's native integration with Fireblocks, which unlocks secure institutional-grade custody and asset management solutions across a network of over 2,400 financial institutions.
Additionally, market sentiment was bolstered by Humanity’s infrastructure expansion into the Sui ecosystem via Walrus Protocol, enabling advanced cross-chain Proof-of-Identity verifications.
Network Growth and Token Unlock Supply Dynamics The protocol has achieved significant adoption, scaling past nine million issued Human IDs, while its broader ecosystem partnerships doubled between late 2025 and early 2026.
However, from a supply-side perspective, upcoming token unlock schedules remain a key risk factor for market participants. The protocol executed a significant release of 105.36 million H tokens on May 25, with another major supply dilution event scheduled for June 25.
Market Positioning Since Exchange Listing Humanity Protocol remains a relatively young asset, with nearly twelve months of public trading history. The project currently sustains a market capitalization of 710 million USDT, securing the #70 spot in global crypto rankings. Its standing All-Time High (ATH) of 0.4008 USDT was recorded back in October 2025.
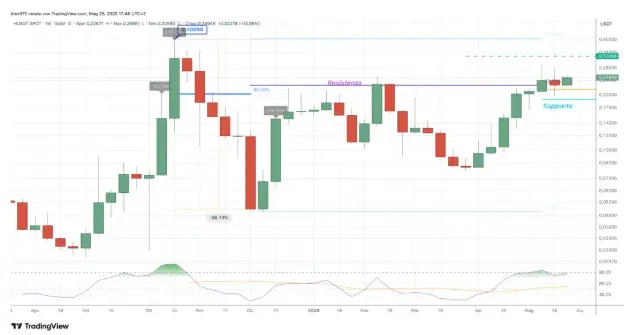
A granular analysis of Humanity Protocol’s weekly chart confirms a highly resilient structural macro trend, with the price sustaining a net positive return relative to its initial exchange listing across the entire twelve-month lifespan.
Following its All-Time High (ATH) in October, the asset underwent a cyclical multi-week correction through November, posting five to six consecutive bearish weekly candles. This distribution phase eventually exhausted its downside momentum at a macro cycle low of 0.0463 USDT in December.
The subsequent impulsive bounce faced persistent selling pressure at a major vector resistance zone mapped at 0.2270 USDT—a level that repeatedly capped upside expansion, forcing another local rejection as late as February 2026. This rejection triggered a secondary macro retracement, driving $H to its current annual low of 0.0738 USDT in March.
The Accumulation Phase and Breakout Attempt "From that March structural floor, Humanity Protocol activated a powerful reversal, printing six consecutive green weekly candles and driving price action straight back into the primary 0.2270 USDT vector resistance zone.
During this re-test, $H attempted an initial aggressive breakout, spiking to a local high of 0.2955 USDT.
While the previous weekly candle consolidated within this supply cluster—closing with a minor -5.70% downside pause—current price action indicates an active attempt to establish a definitive close above this vector resistance. A successful consolidation above this level sets a clear near-term technical target toward the 0.32 USDT zone, opening up a clean volatility runway for an acceleration toward its previous ATH.
Humanity Protocol Near-Term Daily Outlook: Trendline Breakdowns and Key Support Confluences
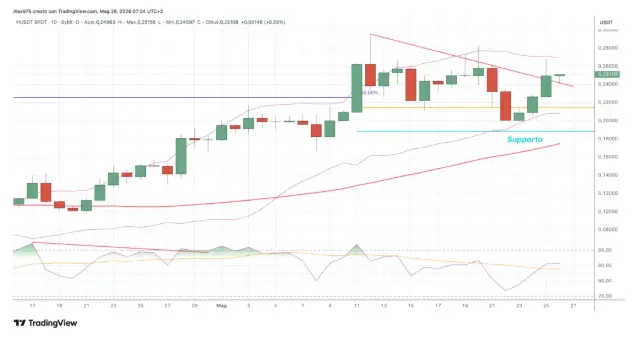
A granular analysis of the daily chart isolates the recent momentum acceleration phase within Humanity Protocol’s ongoing macro uptrend. Following its local peak printed two weeks ago above key resistance, $H entered a near-term corrective phase.
This downside pressure officially forced a bearish breakdown below its primary short-term support at 0.2140 USDT, represented technically by the ascending orange trendline. This breach indicates a temporary exhaustion of immediate buying pressure as short-term market participants lock in profits.
Primary Support Clusters and RSI Momentum "Despite the trendline violation, the primary structural defense zone sits lower on the chart in the 0.1880 USDT area. This key level aligns precisely with the 50% Fibonacci retracement level calculated from the March macro swing low to the recent local high.
Adding to this structural confluence, the 50-period Simple Moving Average (SMA 50) is currently traversing just underneath this Fibonacci level, reinforcing the zone's validity as a major accumulation floor.
On the momentum front, the Relative Strength Index (RSI) has successfully stabilized following the recent price contraction. The oscillator is currently printing a bullish continuation signature, crossing back above its moving average while remaining comfortably below overbought territory, suggesting ample room for an upward expansion if the support holds






