
US-Iran Standoff Enters Critical Phase
The confrontation between the United States and Iran is entering a critical phase. The existing truce remains active but lacks an official renewal, amid mutual accusations of violations. Washington is contesting the closure of the Strait of Hormuz, while Tehran denounces the naval blockade and the seizure of an Iranian vessel. In this context, cryptocurrencies recorded losses over the weekend, while stock index futures opened in negative territory.
Hormuz Paralyzed and Escalation Risks
The Strait of Hormuz is effectively closed, with vessels being turned back or attacked by Iranian forces. Global energy traffic is suffering significant delays as oil tankers remain stationary. Meanwhile, the United States is maintaining its blockade and strengthening its military presence.
Without an agreement before the April 22nd truce deadline, a rapid military escalation remains the most likely scenario, with immediate impacts on oil prices and heightened volatility across both crypto and equity markets.
Stock Indices Down, Oil Rising
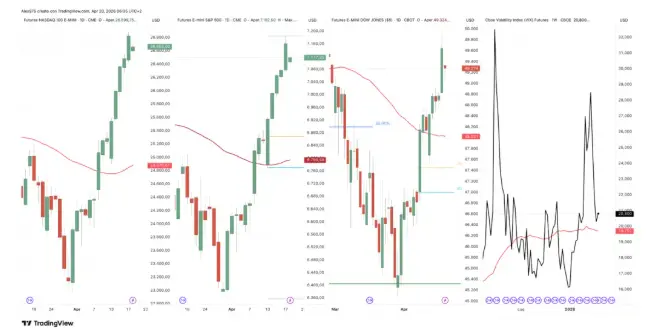
Overnight, US stock indices opened in the red: the S&P 500 and Nasdaq are down approximately -0.60%, while the Dow Jones is retracing by -0.73%. A similar situation is unfolding across European markets.
Oil Prices Surge as Markets Open
Oil prices have reacted sharply to the situation as official trading opened higher. WTI futures are up +6.80%, trading at $87.80 per barrel, while Brent recorded a +5.70% increase, reaching $95.50 per barrel.
Bitcoin Technical Scenario
The crypto market felt the weight of tensions over the weekend, with cryptocurrencies retracing on both Saturday and Sunday. Currently, Bitcoin is trading at 74,450 USDT, showing a slight gain of +0.60% at the time of writing.
Bitcoin Daily Analysis & Support Levels
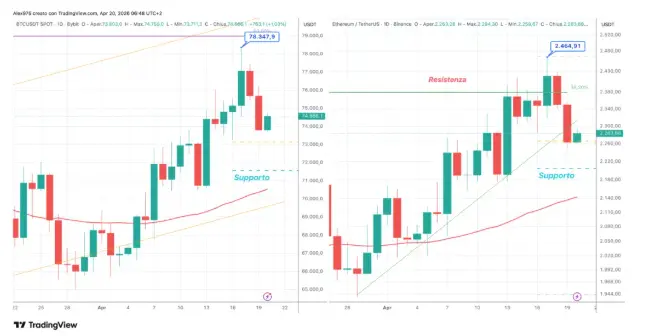
Looking at the daily chart, we can observe the April bullish leg reaching just below the main annual resistance at 79,000 USDT, followed by a retracement phase. In this descent, BTC finds its first support at 73,150 USDT, while the main support level sits in the 71,500 USDT area.
Ethereum Underperforms During the Weekend
As for Ethereum (ETH), it suffered more over the weekend, dropping by -6.50%. It is currently trading at 2,280 USDT, and the daily chart shows a clear downward phase. The price is now resting on the first vector support at 2,260 USDT, with the main support further down in the 2,200 USDT area.
Statistical Overview: BTC & ETH Sequences
The crypto market in the coming week will be dominated by tensions surrounding the April 22nd truce deadline; therefore, intraday trading will carry high risks of sudden volatility spikes. A week ago, we published a statistical study on Bitcoin candle sequences, showing that a configuration of three consecutive bullish candles offered a 65% win rate by the third day. Recent price action has confirmed this indicator.
Those who entered on April 11th near 72,000 USDT were in positive territory by the third day. In the following days, BTC accelerated upward, hitting 78,000 USDT on April 17th. On that date, our indicator recorded its highest quality score of recent sessions at 0.94, with a bullish trend-following bias confirmed by persistence across all three timeframes.
Weekly Chart Confirms Bullish Bias
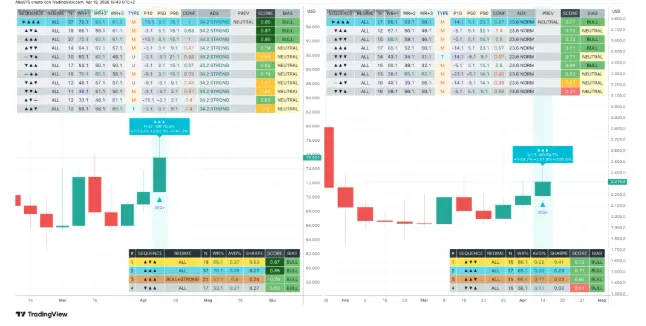
On the weekly chart, Bitcoin has closed its third consecutive positive week. This specific sequence has occurred 37 times in history; in 70% of these cases, the following week also closed higher. The probability of a continued rally remains above 60% even into the second and third following weeks.
The weekly quality score—which synthesizes statistical reliability on a scale from 0 to 1 by combining edge, data consistency, and temporal stability—has reached 0.85 with a BULL bias, confirming that the macro framework remains robust."
Ethereum’s Fragile Bullish Bias Ethereum (ETH) shows the same configuration of three consecutive green weeks, with a 65% win rate across 17 historical instances. However, its quality score stalls at 0.71, and the statistical edge evaporates almost entirely after the first week: the probability of a rally drops to 52% in the second week and 50% in the third. Consequently, ETH's weekly bullish bias appears significantly more fragile compared to BTC.






