
Yesterday, the crypto markets continued their upward trend, reaching key resistance levels for numerous tokens. Specifically, Bitcoin touched the 79,000 USDT resistance, while Ethereum reached the 2,400 USDT area. Today, both are in a retracement phase, mirroring the broader crypto market. BTC is down 0.40%, while ETH is recording a sharper decline of -1.40%.
Crypto Slowdown at Resistance Levels
Ethereum is showing more pronounced weakness, currently trading at 2,338 USDT. While it remains positive for April with a +10.96% gain, its Year-To-Date (YTD) performance remains firmly in the red at -21.40%.
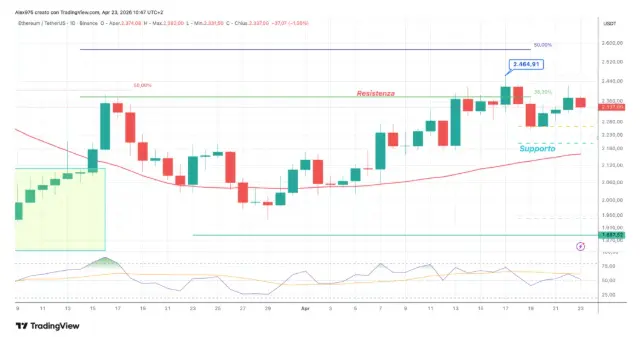
Ethereum Daily Outlook: Resistance Holds and Technical Weakness Emerges
On the daily chart, the last three days of gains failed to push ETH above last week's high of 2,464 USDT. Yesterday, the price closed again below the vector resistance at 2,380 USDT, which corresponds to the 38.2% Fibonacci retracement level of the move from the annual high down to the February low of 1,748 USDT. The primary resistance remains at 2,600 USDT, aligned with the 50% Fibonacci level.
Ethereum vs. Bitcoin: Relative Strength Divergence
ETH continues to exhibit greater weakness compared to Bitcoin. While BTC is stalling at its 79,000 USDT resistance (corresponding to the 50% annual vector), its Year-To-Date (YTD) decline is a more contained -11.20%, versus ETH's steeper drop. Short-term support for ETH is seen at 2,355 USDT. Below that, the critical levels are 2,260 USDT (tested over the weekend) and the primary support at 2,200 USDT, which intersects with the 50-day Simple Moving Average (SMA 50).
Technical Indicator Alert: RSI Weakness
The RSI indicator at the bottom of the chart confirms this bearish momentum. During the recent three-day rebound, it failed to break above its yellow moving average, continuing a pattern of lower highs and lower lows.
Ethereum: Fourth Consecutive Green Week
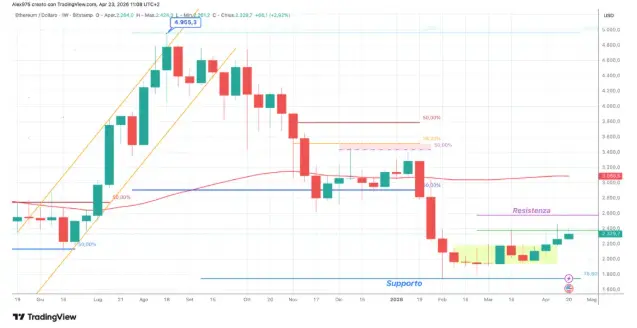
The slowdown of ETH below its first resistance is even more evident on the weekly chart, looking at the trend from its ATH of 4,955 USDT in August to the present. However, the current hesitation at resistance remains a short-term assessment. The current weekly candle is still up +3.40%, marking the fourth consecutive week in the green—a bullish streak not seen since June of last year.
Ethereum’s Bullish Bias Holds: Statistical Outlook
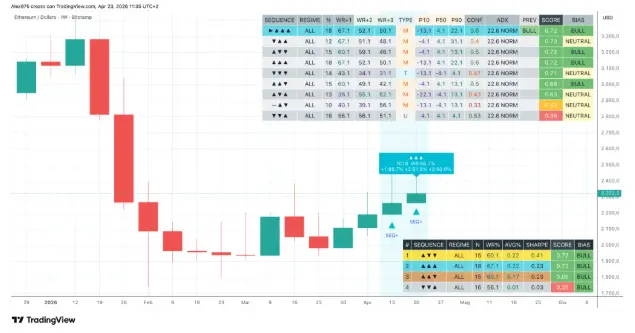
Ethereum is on track for its fourth consecutive positive week. The Candle Sequence Analyzer (internal processing by Criptovaluta.it®) confirms last week's signals. A sequence of three bullish weekly candles has occurred 18 times in the past, with the following week closing higher in 67% of cases. However, ETH's bullish bias remains more fragile compared to Bitcoin's, with the statistical advantage typically fading after the first week. Currently, the quality score stands at 0.72, indicating a context consistent with the current upward direction.
ETH Perpetual Futures: Short-Term Weakness Confirmed
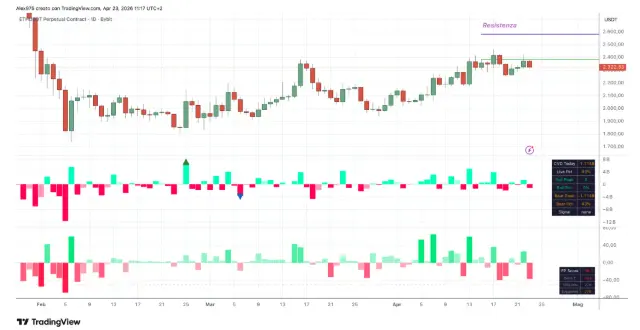
The daily CVD (Cumulative Volume Delta) for Ethereum perpetual futures has hit -$830M, signaling the heaviest selling pressure in recent sessions. Despite this intense flow, the live percentile at 31% places this bearish pressure in the lower-middle range over the last 14 days. Previous sessions showed strong buying interest that failed to break the 2,400 USDT resistance. The Footprint Score confirms that active sellers are currently dominating the order book, suggesting a heated battle under resistance with a return of bearish momentum.






