
In this hot August, not only Ethereum shines among the Top 20, but also ChainLink (LINK), which since the start of the month has recorded a gain of +35.84%. Currently, $LINK is trading at 22 USDT, and on a weekly basis it is showing a slight -1% contraction after reaching a peak of 24.74 USDT three days ago.
ChainLink dominates the Top 20 in August
The strength of the past two months has brought LINK back into the green on a yearly basis as well, with a gain of +9%.
Weekly Overview of ChainLink

Looking at August performance within the Top 20: ChainLink stands out with a +35.70% increase, followed by Cardano (+33%) and Ethereum (+27.38%). This move has pushed LINK’s market cap to $14.8 billion, placing it at 12th in the CoinMarketCap ranking, recently overtaken by Hyperliquid, which has been performing strongly over the past week.
ChainLink Reserve: the new factor
One of the drivers behind LINK’s August rally has been the launch of the ChainLink Reserve. This is an on-chain reserve of LINK tokens aimed at strengthening the network’s sustainability and value. Funded by off-chain revenues and on-chain fees, it has already accumulated more than 109,000 LINK (2.4 million USDT). Bound by a multi-year policy, it reduces circulating supply, introduces deflationary pressure, and—with institutional partners—further consolidates trust and adoption of the network.
Weekly Overview of ChainLink
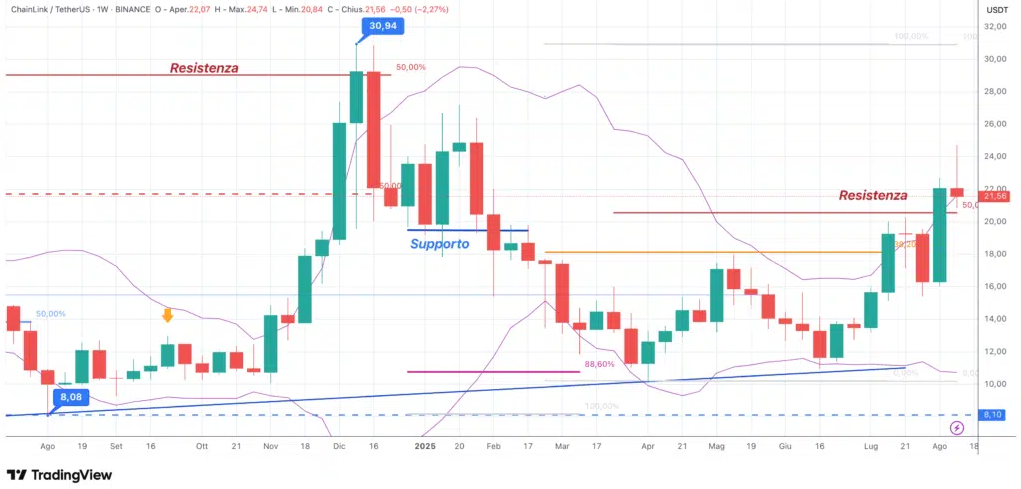
ChainLink’s performance can be traced on a weekly chart starting from last summer, when it hit a low of 8.08 USDT. From that level, a strong uptrend began, taking the price up to 30.94 USDT in December.
The chart shows how the price stalled at the long-term resistance of 29 USDT, a key level for a potential reversal and continuation of a ChainLink bull market. The following weeks saw a clear bearish phase, continuing through 2025 until breaking the support area at 19.40 USDT.
2025 Decline and Rebound
The decline drove LINK to a low of 10.10 USDT in April, from which a rebound phase began, pushing the price up to the 18.10 USDT resistance, a level already highlighted in the April 24 analysis. From there, a retracement followed, bringing LINK back down to 10.94 USDT in mid-June.
August Breakout
From that level, a new bullish phase started, which in August led to a decisive breakout of the medium-term resistance at 20.50 USDT. Last week’s candle closed with a +35% gain, while the current one is showing a -2.40% pullback after reaching a high of 24.74 USDT.
The ongoing weekly candle currently forms a doji, positioned slightly above the resistance level. This setup may indicate possible reversal patterns, making it crucial to wait for tomorrow evening’s close to confirm the trend direction.
Bearish pressure for $LINK in recent sessions
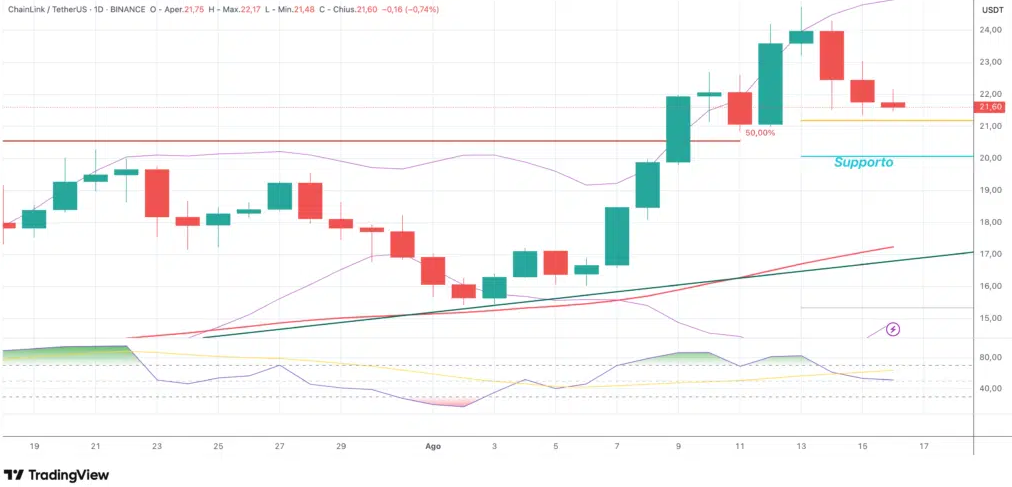
On the daily chart, $LINK’s August rally peaked at 24.74 USDT three days ago.
The last three candles, including today’s, are negative, signaling a slowdown in bullish momentum. LINK is approaching the first support level at 21.10 USDT.
Key Support and Downside Risks
The main support level for this move is at 20 USDT: losing this level could push the price down toward the 17.20 USDT area, where the SMA50 and the support trendline converge.
If this area is lost, ChainLink could slide down to the 14 USDT zone, setting up a broader corrective scenario.


