
Chainlink Forecast: $LINK Price Projections for 2025/2026
The forecast sheet for Chainlink’s (LINK) price trend is based on a combined use of technical analysis, fundamental analysis, and sentiment analysis.
The drafting criteria for this sheet follow three main guidelines:
Technical Analysis: Based on historical price and volume data to identify trends and patterns. Uses trend, momentum, and volatility indicators.
Fundamental Analysis: Evaluates factors affecting the intrinsic value of a cryptocurrency, such as market capitalization, circulating and total token supply, community size, leadership team, listings on major exchanges, and partnerships with reputable institutions.
Sentiment Analysis: Measures market sentiment through social media activity and news flow.
Current Chainlink Scenario

August has been very positive for $LINK’s price, which is up +27% and has turned its year-to-date performance green again. This rebound from the April low of $10.10 USDT marks roughly a +120% increase. At the current value, Chainlink has reached the 11th position in CoinMarketCap’s ranking, surpassing Hyperliquid.
Historical Chainlink Scenario
In the summer of 2024, the entire altcoin sector experienced strong momentum, and Chainlink joined the bullish phase. Looking at LINK’s attached monthly chart, we have an overview starting from 2021, when it recorded its ATH in May at $53 USDT.

From there, a sharp bearish phase followed, with a correction of about -90% from the peak down to the June 2023 low at $4.76 USDT. The chart also highlights a congestion phase, with the price moving sideways from June 2022 to October 2023, when a breakout occurred, leading to an initial bullish acceleration. This was followed by a bearish swing, reaching a low in August 2024 at $8.08 USDT.
From that point, a consolidation phase began, culminating in a rally that took LINK’s price to a December 2024 high of $30.94 USDT.
In 2025, after a January close at -41% (LINK’s worst month since March 2020), a low was recorded in April at $10.10 USDT, starting another consolidation phase. July closed with +26.50%, followed by August at +27%. Currently, LINK is breaking through the key resistance at $20.75 USDT, which corresponds to the 50% Fibonacci retracement from the December peak to the April low.
The first target is the $26.50 USDT area, with the next resistance at $30 USDT. The main resistance around $30 USDT corresponds to the 50% Fibonacci retracement from the ATH to the 2023 low.
Fundamental Analysis of Chainlink
From the attached table, we can see that Chainlink’s technical scenario shows strength.
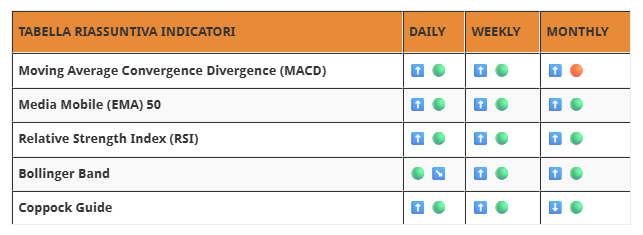
Short Term: LINK shows a bullish trend with SMA 50 and ADX rising. Positive RSI, with stochastic and CCI in overbought territory confirming upward pressure, while a declining ROC signals a slight slowdown. Bollinger Bands and ATR indicate decreasing volatility.
Medium Term: SMA 50 and ADX confirm a bullish setup, with MACD and Aroon indicators positive. RSI and ROC remain favorable, stochastic is positive, and CCI in overbought territory. Price is near the upper Bollinger Band, indicating ongoing momentum and potential trend extension.
Long Term: The positive trend continues, with an overall bullish structure, RSI in overbought territory, and a rising stochastic indicating structural strength. The goal for continuation is a breakout above the first key resistance at $26.50 USDT.


