
Bitcoin (BTC) closed July with an 8% gain. However, the final days of the month had already begun to show signs of weakness. The first day of August turned negative, with a -2.17% drop, and at the time of writing, BTC is trading at $114,150.
Bitcoin Ends July Up 8%, But August Starts Weak
On the attached monthly chart, July’s close marks the fourth consecutive positive month — an event that has occurred only ten times in Bitcoin’s history. More significant than the green close, however, is the new all-time high reached at $123,236 USDT.
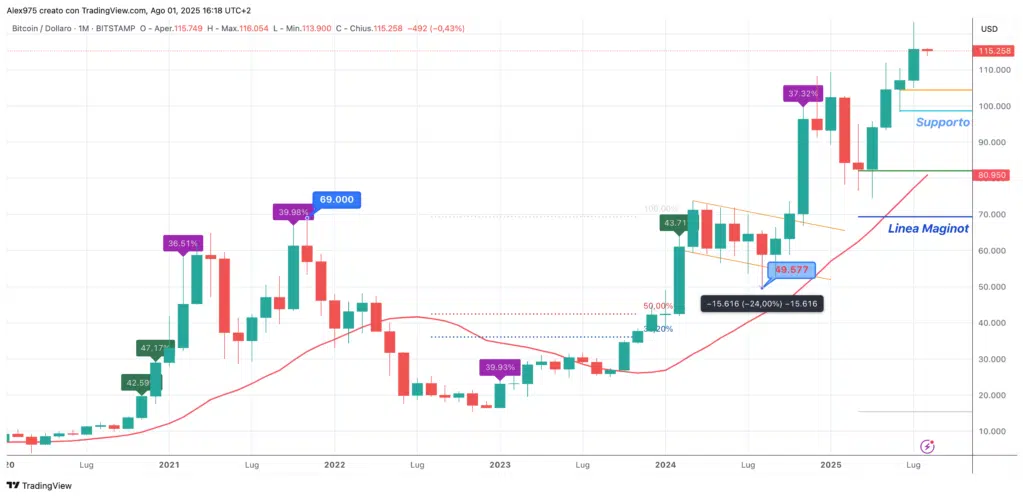
Four Consecutive Months of Gains
The attached table shows that July has historically been one of Bitcoin’s most favorable months, with 10 positive closes out of 15. However, July also marks the beginning of what is, statistically, the weakest quarter for the market. In particular, August and September have a historically negative track record.
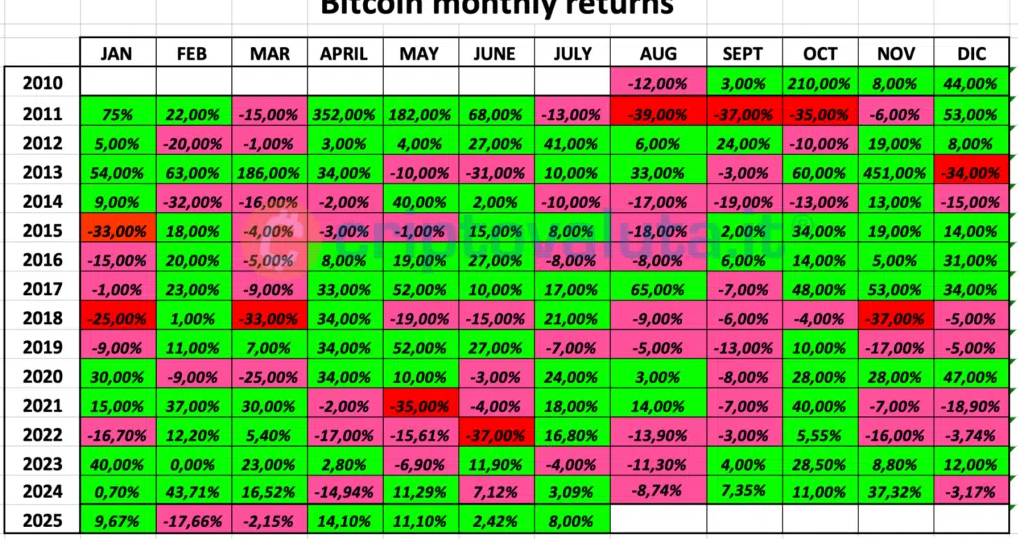
Q3 Is Statistically the Weakest — But Not Always…
Historically, Bitcoin’s third quarter (Q3) is the weakest of the year, with an average return of +6.5% but a median around -2.6%. However, in post-halving years (such as 2025), Q3 has often delivered strong gains, even after initial corrective phases.
Another favorable factor comes from August returns in post-halving years, which have mostly been positive: +30% in 2013, +65% in 2017, and +14% in 2021. We’ll see whether this positive streak will continue in 2025. From this halving-related scenario, we refer back to our July 26 article, which suggested there could still be a three-month window for a new all-time high.


