
The Ambiguous Market Phase
There are moments when markets rally and everyone smiles, and times when they crash and everyone panics. Then there are phases like the current one, where equity indices strike new highs, bond yields edge upward, inflation remains sticky, and the crypto market breathes a heavy, suspended air. It is during these ambiguous phases that market sentiment becomes the ultimate tool for deciphering reality.
Simplifying Sentiment Analysis
While premium metrics based on Twitter analytics, social volume, Google Trends, and proprietary algorithms from platforms like Santiment or LunarCrush are useful, they are often behind paywalls and complex to interpret daily. To truly understand current market dynamics, four free and accessible indicators are more than enough. Let’s break them down one by one.
Indicator 1: Perpetual Futures Funding Rates (The Lack of Speculators)
The first indicator is the perpetual futures funding rate, which gauges the positioning of leveraged traders. When the rate is positive, long positions pay a fee every eight hours to keep their trades open; when negative, shorts pay longs.
Currently, the aggregate Bitcoin funding rate sits at -0.0012%—slightly negative—with a very tight exchange spread of just 0.0392%. This technical setup reveals that the market is entirely devoid of speculative euphoria, indicating a healthier, spot-driven foundation rather than an over-leveraged retail frenzy.
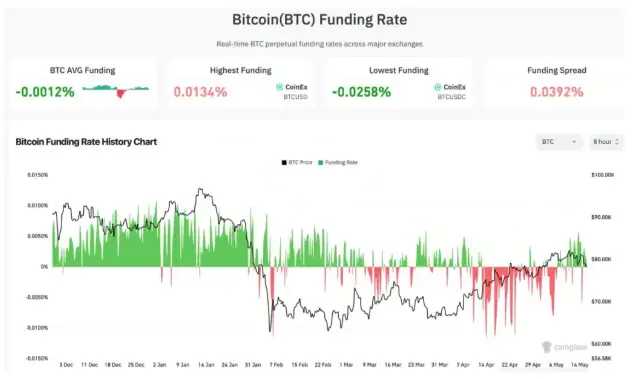
Looking at the historical data offers a more compelling insight. Since early February 2026, the funding rate has frequently oscillated between neutral and negative territory, marked by significant downward spikes throughout April and May. Even as Bitcoin clawed its way back above 80,000 USDT, long positions refrained from stacking excessive leverage.
This environment points to an organic, grinding uptrend sustained by spot demand rather than futures speculation. While this structural health is historically a bullish indicator, it lacks the speculative mania that traditionally provides the explosive momentum for parabolic rallies.
Indicator 2: Exchange Netflow (Accumulation Decelerates)
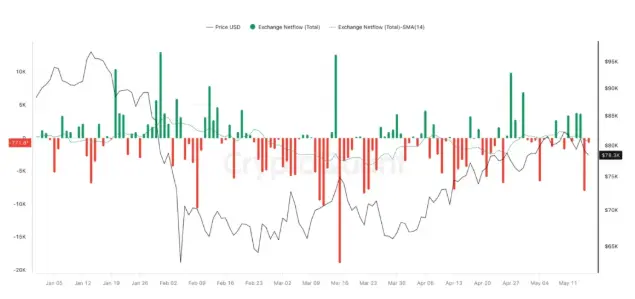
The second metric is the 'Bitcoin: Exchange Netflow (Total) – All Exchanges', which tracks the net volume of BTC entering or leaving trading platforms. The metric shows a dominant wave of net outflows spanning from January to April. This confirms that investors aggressively accumulated Bitcoin and moved it into cold storage during the major correction phases below the 70,000 USDT mark.
The Shift in Accumulation Dynamics
However, since the beginning of May, a clear shift has emerged. Green netflow bars have begun alternating with red ones, pulling the moving average back toward the zero line. The period of 'discounted' accumulation has effectively exhausted itself, marking a distinct pause in the buying phase that had structurally supported the market over the last few months.
Indicator 3: ETF Flow (Institutional Capital Pullback)
The third indicator—and a notably bearish one—comes from the spot Bitcoin ETF complex. Over the last fifteen days, U.S. spot BTC ETFs recorded nine days of net outflows against only six days of inflows.
May 13 stood out as the most severe session, witnessing a massive $630 million (USDT) aggregate flight from these funds. BlackRock’s IBIT led the exodus, shedding $284 million, while Fidelity’s FBTC compounded the bleeding by losing an additional $133 million.
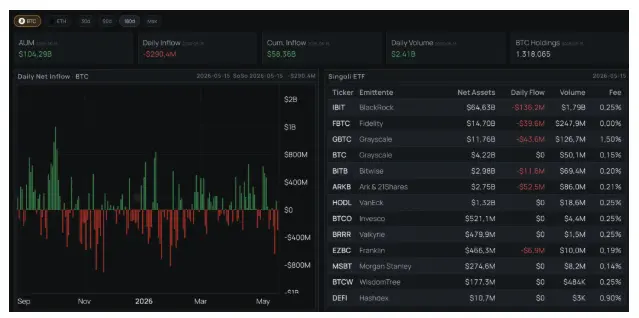
Despite the structural shift in daily flows, the aggregate Assets Under Management (AUM) for U.S. spot Bitcoin ETFs remains remarkably resilient, sitting comfortably above $104 billion (USDT), with 1,318,065 BTC held in custody. However, the trajectory of these daily net flows has taken on a distinctly distributive character since February.
Indicator 4: Crypto Fear & Greed Index (Retail Exits Extreme Panic)
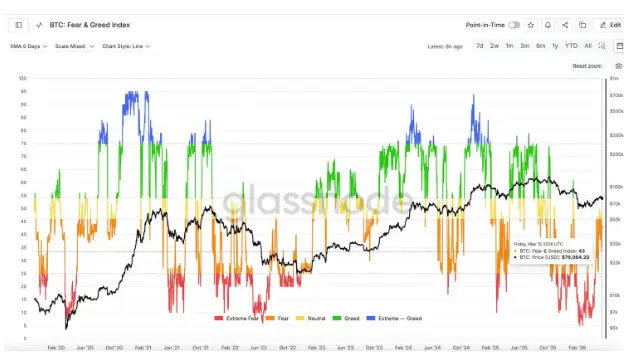
The final and most traditional sentiment gauge is the Crypto Fear & Greed Index, which currently prints at 43. While this remains within the 'Fear' quadrant, it marks a significant recovery from the 'Extreme Fear' levels recorded during the sharp corrections of previous months.
Historically, structural market bottoms form when the index sustains prints below 20, while macro tops solidify above 80. The current reading positions the market in a neutral/transition zone, typically characterized by slow trend-building or prolonged horizontal consolidation. Retail investors have stopped fearing a catastrophic crash, but they lack the conviction to buy into a breakout.
Piecing these four metrics together reveals a highly fragmented landscape: cautious speculators, decelerating long-term holders, retreating institutional funds, and a neutral retail base. No single participant class is positioned at a sentiment extreme; instead, each is moving in a slightly distinct direction. This dynamic represents a systematic hand-off between different tiers of holders, rather than a capitulation event or generalized market panic. Sellers and buyers are actively matching orders, but for completely opposing structural reasons.
The Verdict on Bitcoin Sentiment
In this current phase, Bitcoin sentiment is refraining from flashing aggressive directional signals. Instead, it narrates a quiet, macro transition that mirrors the structural uncertainty currently observed in Bitcoin's horizontal price action.






