
Yesterday afternoon, the announcement of Iran’s supposed reopening of the Strait of Hormuz to naval passage was released, at least until April 22, the scheduled end date of the truce agreement. The crypto market celebrated, and Bitcoin in particular returned as the leader of the ecosystem with a bullish surge into the 78,000 USDT area.
Bitcoin Monthly Overview
Currently, BTC is trading at 78,100 USDT, recording a +14.50% gain in April. However, since the beginning of the year, it remains in the red by -10.80%.
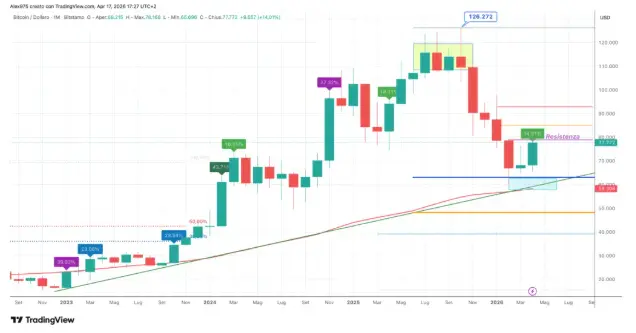
On the monthly chart, we can observe the overview of BTC since the November 2022 lows, from which the bullish leg started, leading to a series of ATHs, with the last one in October 2025 at 126,272 USDT. Here, the summer congestion is also highlighted, with a breakdown that triggered a five-month decline until the February 2026 low at 60,000 USDT. March closed positive by +0.84%, while April is currently recording an excellent rally. To find a similar performance, one must look back to April 2025.
BTC Toward the Key Resistance at 79,000 USDT Now, the price is approaching what is the first vector resistance at 79,000 USDT, which we have highlighted multiple times. A breakout would confirm the strength of the current rebound, leading to a continuation toward the 85,000 USDT level.
Bitcoin Weekly Overview
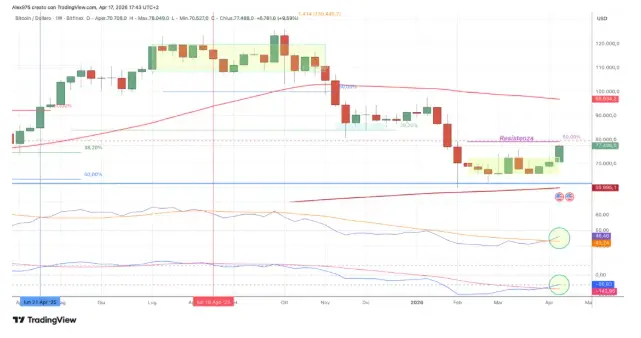
Moving to the weekly chart analysis of BTC, we highlight the summer congestion phase and the relative price contraction toward the 60,000 USDT area in February 2026. Here, BTC built a base for the rebound attempt currently underway toward the 79,000 USDT resistance.
BTC Weekly Indicators Setup
This is a medium-to-long-term operational setup; therefore, it is not suitable for short-term or intraday trading. With the close of last week's candle, there was a substantial entry around the 70,000 USDT area. The chart also marks recent signals: the last entry was made in April last year in the 90,000 USDT area, with the subsequent exit around 114,000 USDT. While the following ATH was missed, this strategy successfully avoided a drawdown of over -40%.
With Bitcoin in the 78,000 USDT area and a monthly gain of 14.50%, we have confirmation of the current strength from a statistical perspective as well. The Candle Sequence Analyzer indicator detects a bullish momentum from a statistical standpoint.
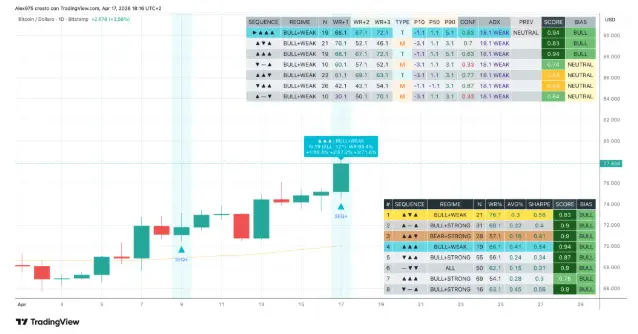
The sequence of the last three daily candles, all bullish, fits into a context classified as BULL+WEAK. This means the price is above the 50-period moving average, but the trend still lacks directional strength as measured by the ADX. This configuration has occurred 19 times in the past; in 68% of those cases, the following bar closed positive, a percentage that rises to 72% by the third day.
The context quality score reaches 0.94 out of 1, the highest value in recent sessions. The trend-following classification indicates a bullish bias that tends to persist over time rather than exhausting itself.
Bitcoin Short-Term Scenario
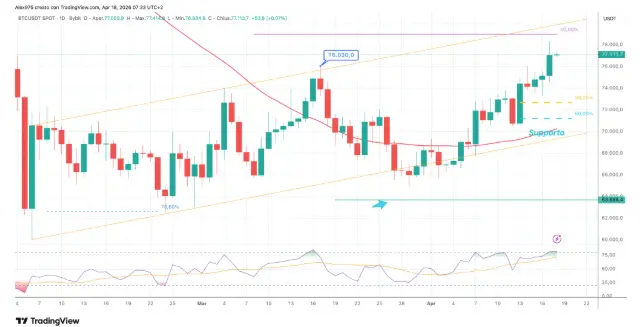
Focusing on the daily chart, we can observe BTC's ongoing rebound phase within the highlighted orange channel from the February lows. At the bottom of the chart, the RSI indicator confirms the strength of the movement as it enters the overbought area, and currently, it shows no signs of divergence.






