
📉 Crypto Market Contracts and Bitcoin Turns Red
Yesterday, the crypto market faced a sharp downturn, and Bitcoin (BTC) also took a strong negative turn, heading to close August in the red. Currently trading at $108,300, BTC is down –4.27% on a weekly basis, marking its third consecutive week of decline — something not seen since last February.
Bitcoin Accelerates to the Downside
On a monthly basis, Bitcoin is down –6.17%, breaking a streak of four consecutive positive months, during which it gained 40%. Despite this, BTC has closed above $100,000 for 109 consecutive days. Since the start of 2025, Bitcoin still shows a gain of +16.30% YTD.
U.S. Macro Context Drags Bitcoin Down
This broad corrective move in the crypto market reminds us that prices don’t rise endlessly. One factor often overlooked during bullish enthusiasm is volatility, which can trigger sudden corrections.
The current downturn can be linked to the “elephant in the room”: U.S. public debt. Yesterday’s release of the Core PCE data, although in line with expectations, confirmed a slight uptick in inflation. This suggests it will be hard for the Fed to implement rate cuts. Such a scenario could lead to so-called fiscal dominance, where central bank policy is dictated by government budgetary choices — a prospect markets dislike. In addition, the latest Chicago PMI data was also disappointing.
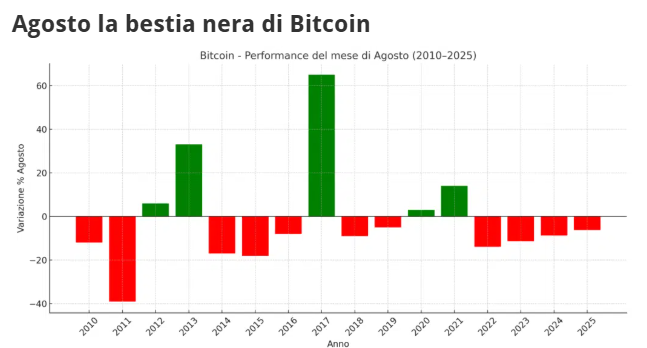
Historically, August is a weak month for Bitcoin. From 2010 to 2025, it has closed in the red 11 out of 16 times (unless it rebounds in these last two days), with an average return of –6.6% and a median of –8.4%. The worst August was 2011 (–39%), while the best was 2017 (+65%). For three straight years (2022–2024), August ended negatively, excluding the current –6.2%. Thus, August statistically emerges as the most unfavorable month for BTC.
Bitcoin Monthly Overview
Looking at the monthly chart, Bitcoin is in contraction, with a candle showing no strong technical features other than an upper shadow. The long-term trend remains intact.

Two key elements stand out:
1️⃣ The ascending channel, within which Bitcoin’s price continues to move.
2️⃣ The crucial support area between $99,000 and $95,000. A breakdown below this zone would put the primary uptrend at risk and trigger a channel breakdown. This support could also act as a rebound point.
If lost, the next support lies between $83,000 and $87,000, though this remains unlikely in the short term.
Bitcoin Weekly Outlook

On the weekly chart, the bearish trend is clear, with three consecutive red candles. BTC is approaching its first vector support around $104,800, which corresponds to the 38.2% Fibonacci retracement of the April low to the ATH.
The next level is the previously mentioned $99,000–$95,000 zone, where the Weekly 50 SMA also intersects.
Weekly Setup Exit
At the bottom of the chart, the weekly indicator setup triggered an exit signal two weeks ago, as highlighted in our August 16th analysis.
⚠️ Note: This setup is a position-based strategy, meaning it is slow-moving and not suitable for short-term trading or scalping.


