
Markets Rally on U.S. Intervention in the Strait of Hormuz
The "Project Freedom" Announcement
The financial week is opening with a strong bullish trend following news of a U.S.-led push to unblock the Strait of Hormuz. On Sunday evening, Donald Trump announced 'Operation Project Freedom,' a mission designed to provide military escorts for commercial vessels to ensure the continuity of maritime trade. While Washington classifies the operation as a 'humanitarian mission,' Iran has reacted sharply, labeling it a violation of the existing ceasefire and threatening retaliation.
Financial Market Reaction
-
Nasdaq & S&P 500: Nasdaq futures have surged to a new all-time high, with the S&P 500 following closely behind as markets react to the potential easing of supply chain bottlenecks.
-
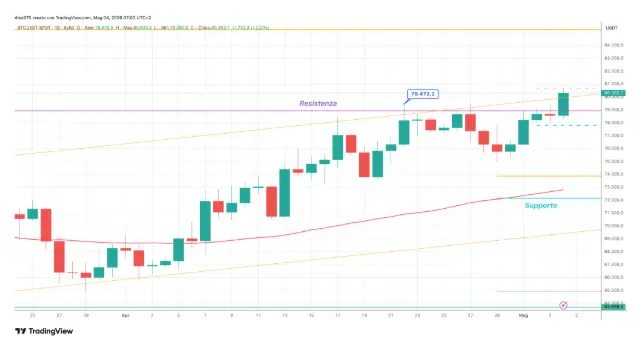
Bitcoin (BTC): Breaking through critical resistance, Bitcoin has officially surged past the 80,000 USDT milestone.
-
Energy Sector (Oil): Despite the equity rally, the oil market remains cautious. Brent crude is currently trading at $108, while WTI stands at $101 per barrel, indicating lingering skepticism regarding a swift resolution.
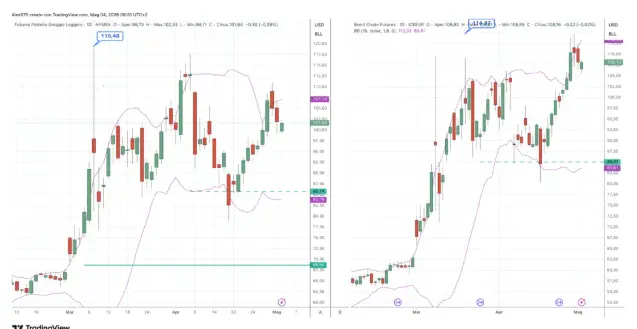
In Asia, the Kospi (South Korea) has reached a new all-time high, driven by its strong ties to the technology sector. Positive momentum is also evident in the Nikkei and Hang Seng indices. European markets are expected to follow suit, with futures pointing toward a positive opening across major bourses. Meanwhile, the Euro/Dollar (EUR/USD) exchange rate remains stable, trading at 1.1752.
Bitcoin’s Bullish Momentum
Bitcoin (BTC) is accelerating its upward trajectory, currently trading at 80,340 USDT. This push brings its total gain for May to +5.26% in just the first few days. On the daily chart, we can observe the current 'leg up' that originated from the early April low of 64,978 USDT, showing a sustained recovery and a breakout of previous local resistances.
Bitcoin Targets $85,000 as Ethereum Attacks Key Resistance
Bitcoin’s Bullish Swing and Key Levels
Over the past four weeks, Bitcoin has moved upward through a series of price swings. After stalling for about twelve days under the 79,000 USDT resistance and undergoing a brief retracement, BTC returned to test this level over the weekend before today’s bullish acceleration. The primary objective is now a move toward the 85,000 USDT area. To sustain this momentum, BTC must achieve a daily close above the previous resistance and hold that level. In the event of a pullback, the first critical support is identified at 77,800 USDT.
Technical Indicators: RSI and Divergence
On the lower section of the chart, the RSI indicator is trending toward the overbought zone. It will be crucial to monitor for any potential bearish divergences between the RSI and the price action, which could signal a temporary exhaustion of the trend.
Ethereum: Attacking Resistance
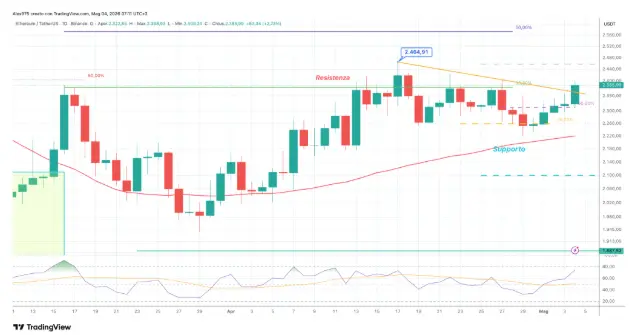
Ethereum (ETH) is also joining the rally, currently trading at 2,387 USDT. ETH has already gained +5.79% in May and is currently battling its first major resistance zone at 2,380 USDT.
The Battle for 2.380 USDT
On the daily chart, it is evident that the current level previously acted as a ceiling for Ethereum (ETH) in March and for several days throughout April. This resistance led to a contraction toward the 2,260 USDT support area, which served as the launchpad for the current breakout attempt. This support level remains a vital floor for the current structure.
Primary Targets and Confirmation
The primary objective for Ethereum remains the main vector resistance at 2,600 USDT. For this bullish scenario to materialize, it is essential for today’s candle to close above the initial resistance level. Furthermore, the RSI indicator is positioned to enter the overbought zone, which would confirm the strength of the buying pressure behind this move.






