Ethereum initially fell during the week ending September 27th, reaching down towards the $360 level before finding support, rallying over $400, and eventually settling around $390 on the week. This is a slightly bearish price setup, but is only natural after 4 massive green candles where ETH exploded to the upside, doubling in price in a month.
(September 27, 2020 9:30 PM EST)
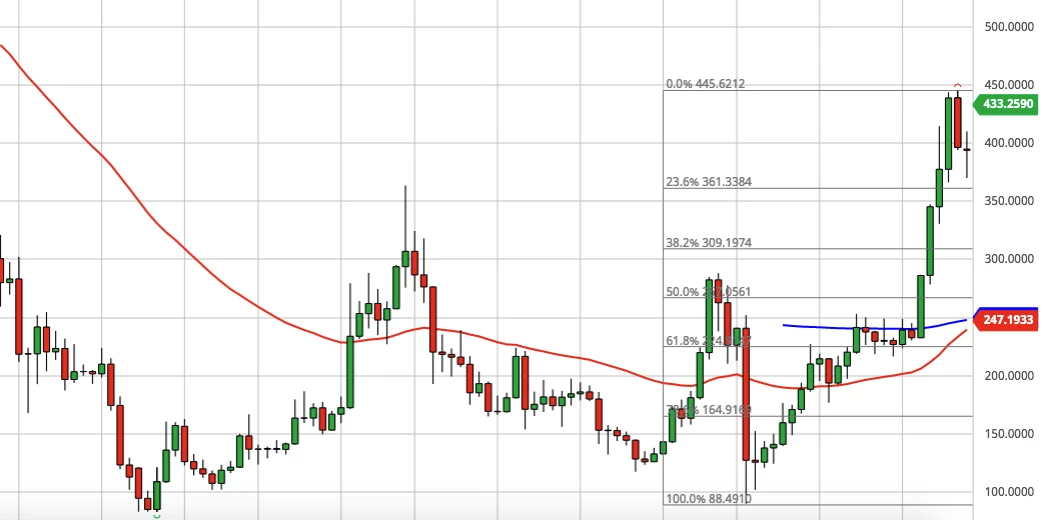
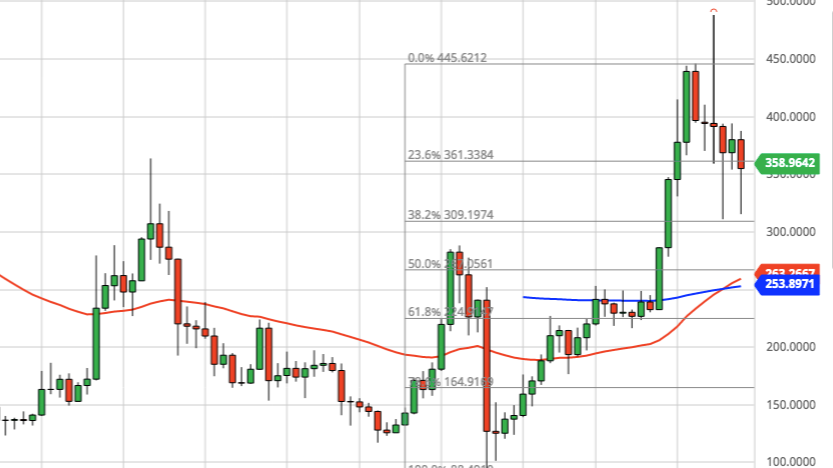
Like Bitcoin, Ethereum is in a consolidation pattern, oscillating between $350 and $400. This is beginning to act as sort of a short-term trading range, at least for now. When you zoom out or consider the weekly chart above, it's easy to see how extended ETH got to the upside. Given how far it is from both moving averages, it would make sense to see a pullback to the 50 Week EMA to digest these gains and build up some momentum for the next leg up. Everything is on track for another bull run in the crypto market, especially for marquee projects like Ethereum, which are "weeks away" from launching Phase 0 of its ETH 2.0 scaling solutions network upgrade. The timing is perfect, as the Federal Reserve has maintained its intention to continue printing money ad infinitum to the tune of ~2%, continually inflating the US Dollar (other governments are doing this as well in the EU), which, economically, should bode very well for fixed or limited supply assets like ETH. Seeing as how 90%+ of Crypto projects are built on the Ethereum network, and given all the government and multinational conglomerates that are collaborating or researching how to work with Ethereum, the stars are aligning for a comfortable next few years.
Support: Ether is currently trading well above the 50 and 200 Week EMA's, which should act as major long-term support below around ~$250, which is also around the 50% and 61.3% fibonacci retracement levels. If ETH falls below the 200 Week EMA around $245, the overall uptrend is in jeopardy. I gather this is extremely unlikely and only accomplished via the entire network being taken down, or another COVID-related March-caliber sell-off; even then, we see such an event as short-term weakness and an excellent opportunity to add and a medium-long term accumulation zone.
Looking ahead, this is a buy on the dips scenario, with longer-term investors looking to add on pullbacks. Next immediate resistance is $400, which has caused some friction as of late, and then the June 2018 highs around $500. If ETH can break above that, there may be some retail investors from early 2018 looking to get out from under their 3 year holds which have been red up until possibly later this year. Remember, Bitcoin has already climbed back 60% of the way to its previous all-time high; ETH is still down almost 70% from its January 2018 all-time high of $1,400, so there are probably additional sell orders ETH needs to slice through in order to get closer to making new all-time highs.
It's also worth noting that the ETH/BTC ratio as it currently stands is historically low and has quite a bit of room to 'catch up' to BTC's upward price movement YTD, as this ratio also works in cycles and indicates whether Ethereum is undervalued or overvalued relative to Bitcoin.
About Us:
I take time out of my day to share these with the community completely free. If you enjoy these posts, please support the channel by "Tipping" this post below, or using either of these referral links below. They cost you nothing and give me a small reward, which makes me a little happier to share these personal analyses with you at no cost.