Ethereum pulled back on Friday along with Bitcoin, shedding about $20 and drifting towards the $350 level. This comes as traditional markets sold off into the NY close, with equities, gold, and Bitcoin selling off, and the DXY rising. Selling off into a Friday close going into the weekend is generally a bad omen for Monday.
(October 16, 2020 8:00 PM EST)
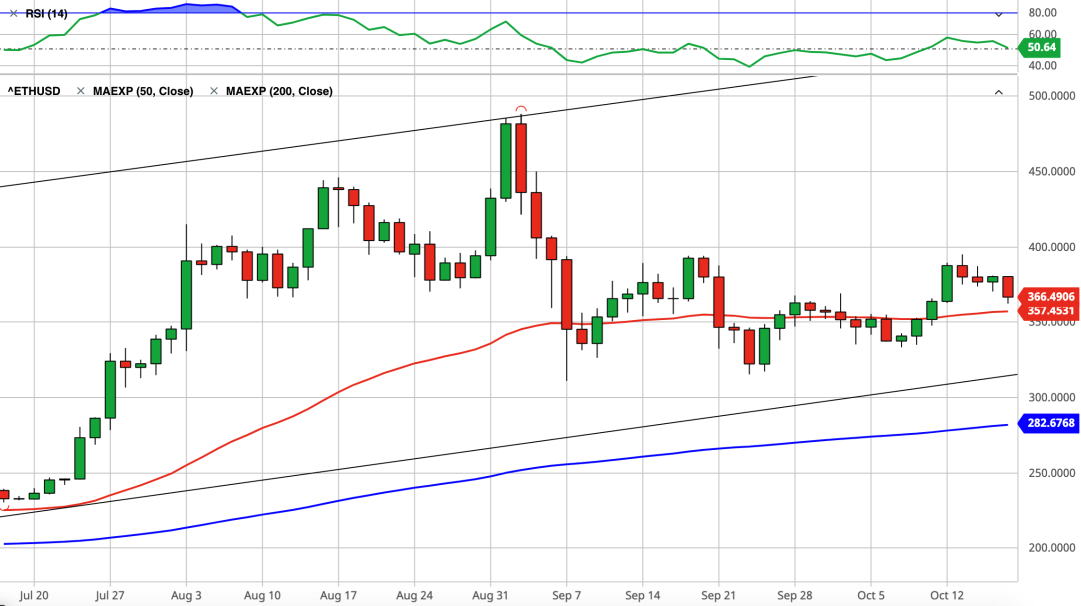
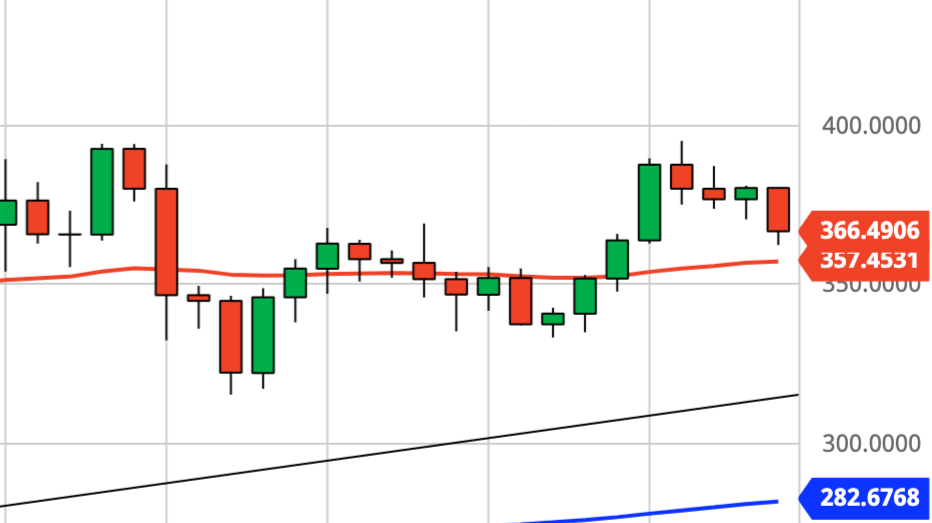
Outlook: ETH took a hit today, selling off from the ~$375-380 level and falling to $366 at the close. This is an interesting scenario because if you look at the chart above, you can see a descending channel inside the greater ascending channel. You can also see the double top that formed just under $400 this past Tuesday, but you can also see a series of higher lows near the 50 Day EMA. Overall, this is still a bullish macro trend based off the price action alone, and ETH's fundamentals speak for themselves. I think the global economic environment is extremely negative for other assets; but not ETH. That being said, near-term weakness in equities, forex, and gold may have some negative effect on ETH's price in the short-term, but I see that as a temporary buying opportunity to load up on dips and DCA. I still think Q4 and beyond into 2021-2023 looks extremely bullish for ETH, and even for equities late this year into 2021, which should only help lift crypto like ETH.
Support: Ether is currently trading above the 50 and 200 Day EMA's, which should act as support below around ~$355 and 280 respectively. A good test we should see in the next few days is whether the 50 Day EMA holds as support around $357, which is close enough to the psychological level of $350. If ETH falls below that, look for support around the ascending trendline I drew in black above, then $300. If ETH falls below the 200 Day EMA around $280, the overall uptrend is in jeopardy. At that point, my line in the sand would be the $225 level which was a previously very supportive level of consolidation.
Resistance: Ethereum appears to have found resistance above around the $400 level, which was also resistive in Q3 2017, but we all know what happened once it broke above there. Look for resistance levels every $50 - 100, as they're round numbers, especially $500. After that, $600-700 is another key fib level, and the actual market value of ETH based on normalization of the ETH/BTC ratio, which is inevitable.
About Us:
I take time out of my day to share these with the community completely free. If you enjoy these posts, please support the channel by "Tipping" this post below, or using either of these referral links below. They cost you nothing and give me a small reward, which makes me a little happier to share these personal analyses with you at no cost.