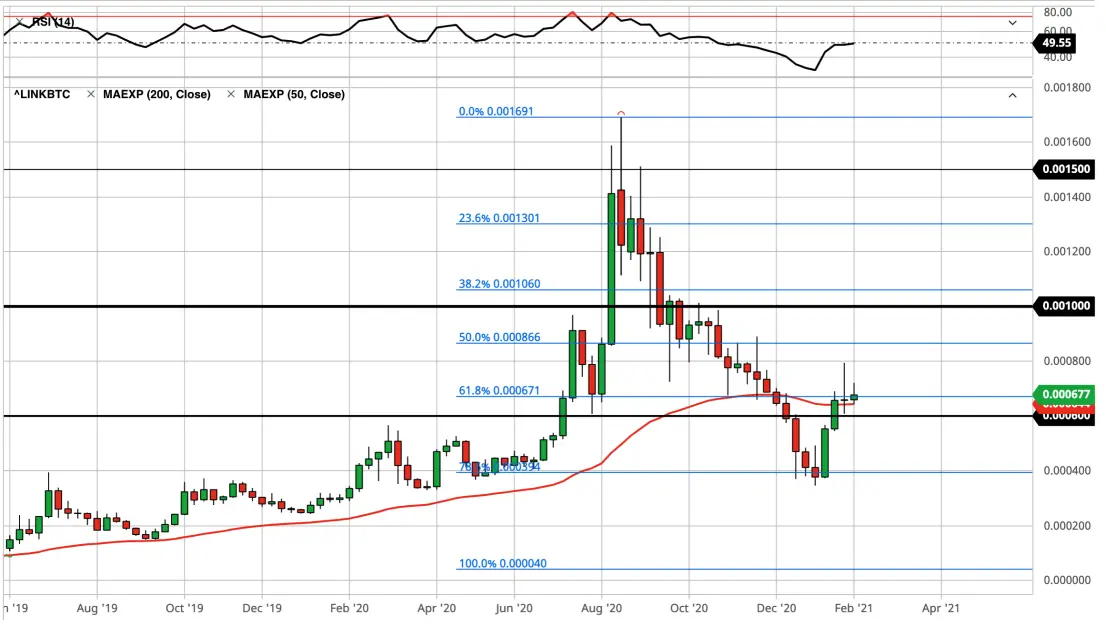
ChainLink rallied early last week to pierce the 50 Week EMA, initially reaching up to the 0.0008 Link/BTC level before pulling back, giving back nearly all of the gains before finding support around the 50 Week EMA around the 0.0006 level. Link has started the week off slightly bullish, rallying a bit above the aforementioned level as Link appears to have broken the long-term downtrend in which Link bled satoshis since Q3 2020.
As long as Link can hold onto the 0.0006 Link/BTC level then I think Link can start to stand its ground against BTC (and thus the US dollar) and resume its uptrend. If Link fall below the 0.0006 level, then I think Link will likely go back to the lows and test support around 0.0004.
In the meantime, as you can see in the weekly chart below, Link was -- and arguably still is -- in an excellently steady long-term uptrend before it went parabolic in mid-2020, reaching up to 0.0017 Link/BTC! However, this was a blowoff top and Link quickly retraced most of the gains, ultimately putting in a bottom in early January 2021. Since then, Link has bounced quite nicely and appears to be finding its footing again. Most interestingly, however, is the higher low it has printed on the long-term chart, finding support at 0.0004, a level Chainlink found support in Q2 2020 shortly before breaking out to the upside to begin its parabolic run. Bullish continuation from here could help Link continue higher as it looks to recover against the satoshi which has crushed many alts in its wake a la Bitcoin's face-melting late 2020 rally.
(February 1, 2020)