TensorCharts is a trading tool that provides real-time market analysis using advanced algorithms and machine learning techniques. This platform is designed to help traders gain a better understanding of market dynamics and make profitable trading decisions based on data-driven insights. In this guide, we'll explore how to use TensorCharts to improve your trading strategy and increase your profits.
Understand the Key Features of TensorCharts
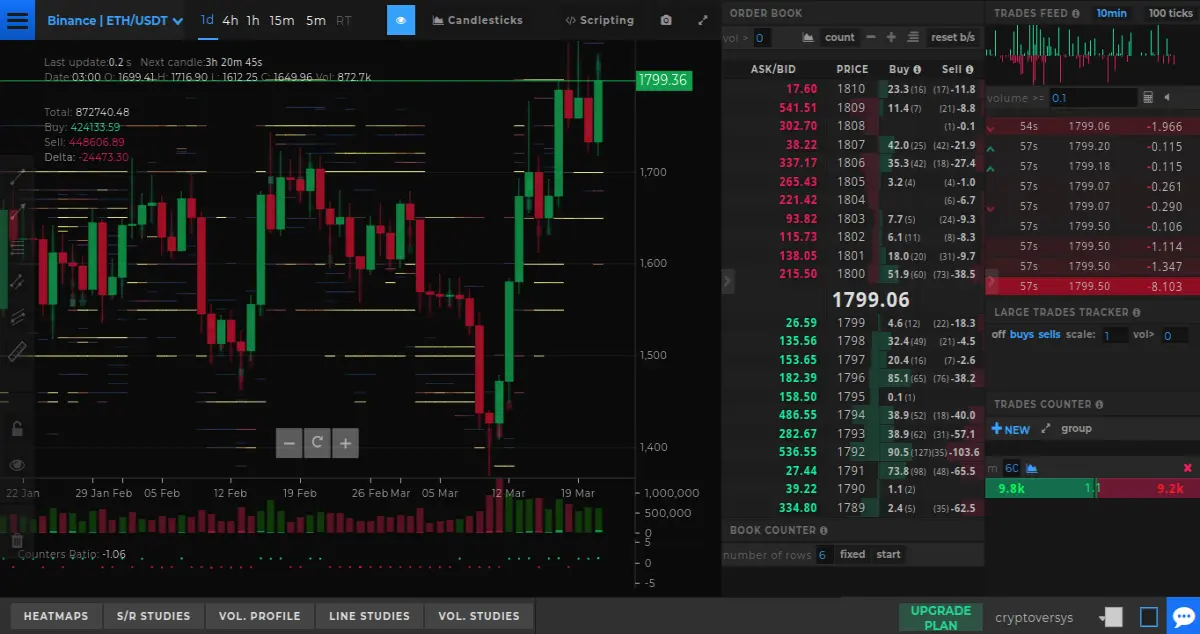
Before using TensorCharts, it's essential to understand its key features. TensorCharts provides traders with a wide range of tools and indicators, including:
Volume Profile: Displays the volume traded at different price levels over a specified period.
Orderbook Heatmap: Shows the distribution of limit orders at different price levels.
Liquidity Waves: Displays the price levels where large volumes of orders are placed.
Volume Delta: Measures the difference between buying and selling volumes.
Footprint Chart: Displays the trading activity at each price level.
These features provide traders with a comprehensive view of the market, allowing them to identify key levels of support and resistance, track the behavior of market participants, and spot potential trading opportunities.
Identify Key Market Levels
To use TensorCharts effectively, it's essential to identify key market levels. These levels represent significant areas of support and resistance and can provide valuable insights into market behavior. Using the Volume Profile feature, traders can identify these levels by looking for areas where large volumes of orders were traded.
Monitor Order Flow
Order flow is the term used to describe the buying and selling activity in the market. By monitoring order flow, traders can gain valuable insights into market dynamics and identify potential trading opportunities. The Orderbook Heatmap and Liquidity Waves features in TensorCharts provide traders with real-time information on the distribution of limit orders and the placement of large volumes of orders.
Analyze Volume Delta
Volume Delta is a powerful tool for identifying changes in market sentiment. By measuring the difference between buying and selling volumes, traders can gain insight into the behavior of market participants. Positive volume delta indicates that buyers are in control of the market, while negative volume delta suggests that sellers are dominating.
Use Footprint Charts for Entry and Exit Points
Footprint charts show the trading activity at each price level, including the volume, price range, and the direction of the trades. This information can help you identify areas of high demand or supply, where the market is likely to move in a particular direction.
Once you have entered a trade, you should monitor it closely. TensorCharts allows you to monitor your trades in real-time, allowing you to adjust your strategy if necessary. You can also use TensorCharts to set stop-loss orders and profit targets, helping you manage your risk and maximize your profits. Using footprint charts on TensorCharts can help traders identify key entry and exit points. By analyzing the trading activity at each price level, identifying key levels, and using other TensorCharts tools to confirm your analysis, you can make informed trading decisions and maximize your profits.
TensorCharts is a powerful trading tool designed for traders who want to gain a competitive edge in the market.
Managing risk: TensorCharts allows you to manage your risk by setting stop-loss orders and profit targets based on key support and resistance levels. You can also use the platform to monitor your positions and adjust your trading strategy accordingly. In conclusion, TensorCharts is a powerful trading tool that provides traders with valuable insights into the market's behavior. By understanding how to use the different features and tools available on the platform, you can make profitable trades and gain a competitive edge in the market.
Read about Fear & Greed Index







