
A few days ago wrote about unbelievable Bitcoin chart that has emerged on the 22nd of September and I thought I am going to do the same with Ethereum to see how it compares. Will Ethereum show promising patterns? Let’s find out!
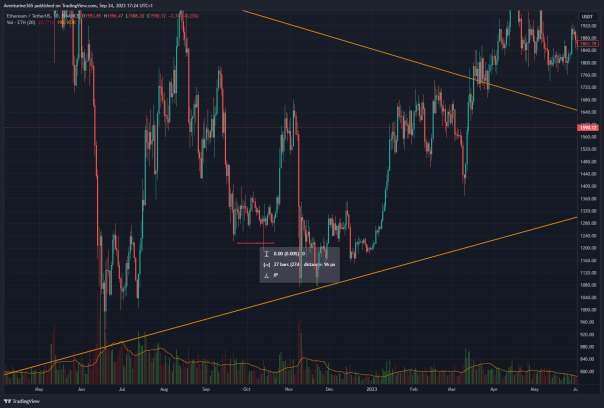
September 24th 2022
It took 27 days before pump, but then bigger dump occured.
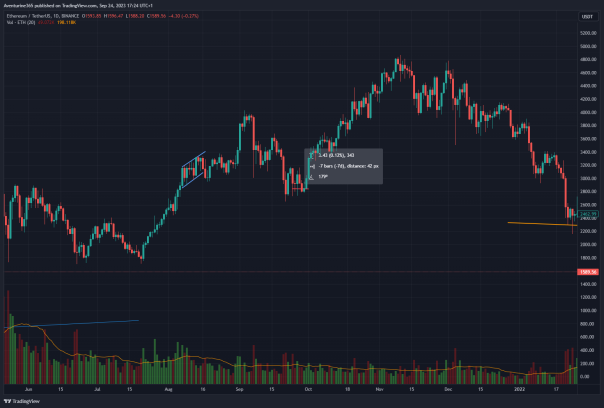
September 24th 2021
7 days Later Ethereum had begun its final run to the top!
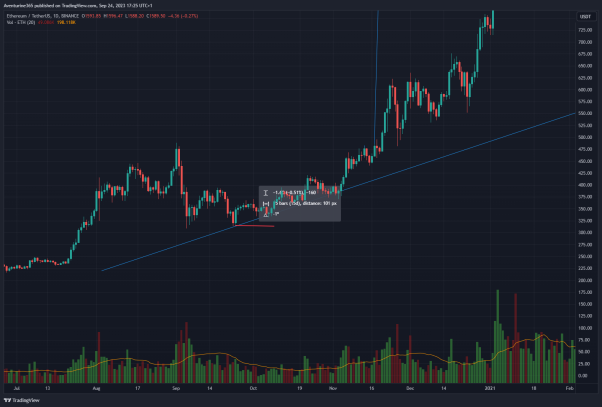
September 24th 2020
15 days later its bull run had begun!
September 24th 2023
Can we expect similar results? Ethereum chart doesn’t look strong if you ask me there is a support line at around $1500 in-fact there are two support lines that cross in mid October!
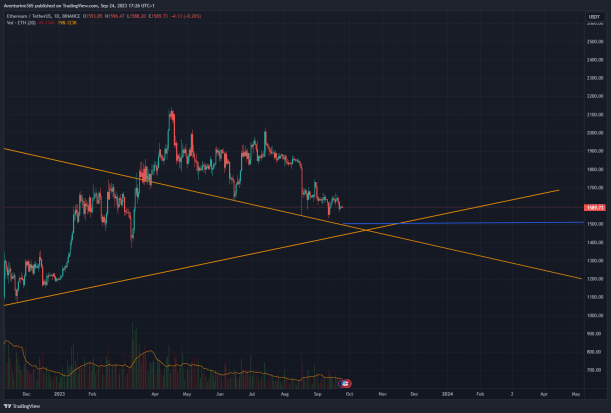
Does the chart on the 2023 resembles the chart of the 2020? Not really. In this regards Bitcoin chart looks so much better.
All The Best,
Aventurine


