
Something Really Weird Had Happen During Recent Drop!
The theory of parallel universe is quite well known subject whether it is true or not it is up for a debate
But something has happen with Bitcoin this week or Bitcoin chart!
The Perpetual chart looks so different to the chart we can see on Spot that it is almost as if it represents a Bitcoin from a parallel universe!
This is the chart as we see it under Spot trading
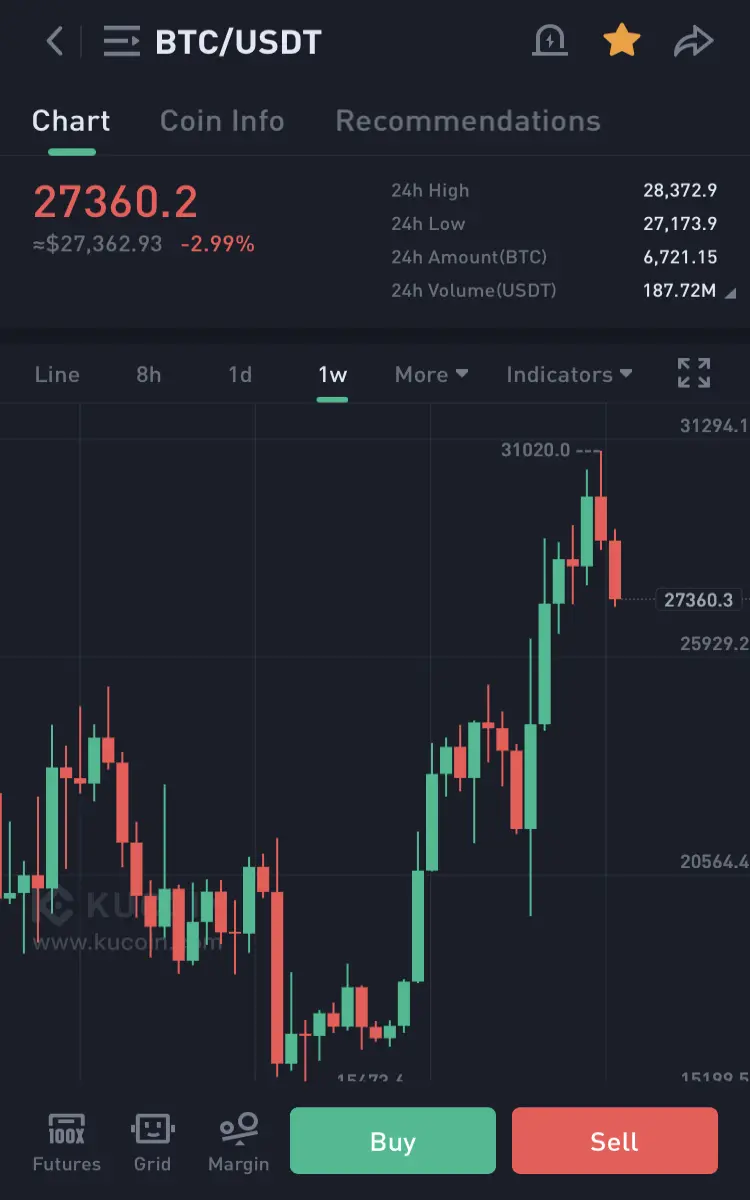
This one is on Perpetual Contracts

Botch charts represent weekly timeframe I know there can be a slight difference between those two charts but not on weekly and that much! Or maybe I have not been following trading for long enough to find this to be quite normal? Trading view states that the data is incorrect and they are investigating the issue!

There is only one explanation…One comes from the parallel universe! :)
But how did it get here? Is there a parallel universe where BTC is just going vertically green? If so, how do we shift there???
Dump has generated so much energy that caused serious glitches in the world…lol





