
The Bitcoin price has broken out from a descending wedge but has yet to move above an important resistance level. Technical indicators have begun to show some weakness.
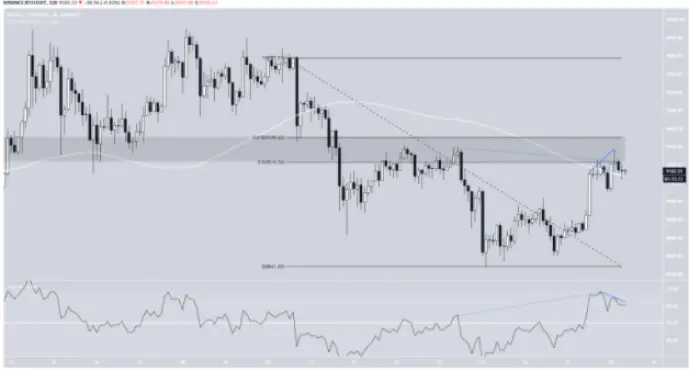
Yesterday, the Bitcoin price began an upward move and broke out above the current resistance level. Furthermore, the price moved above its 200-hour moving average (MA).
Bitcoin Falling Wedge
This is where the bullish signs end, however. The price was rejected by the $9,250 resistance area and created a long upper-wick. This area previously acted as resistance and is found between the 0.5-0.618 Fibonacci levels of the previous decrease.
Finally, there is both a regular and a hidden bearish divergence developing, making it likely that the price will decrease as a result.
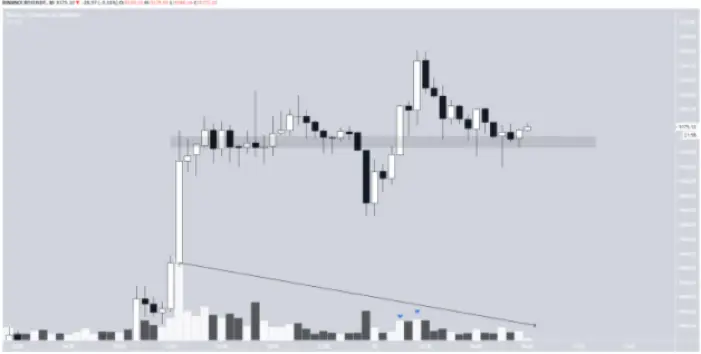
In the short-term, the price is still trading above a minor support level at $9,155. However, fitting with the divergence we saw in the previous section, there was also decreasing volume during the upward move, especially that which caused a high of $9,280 to be reached.
This is a bearish sign that suggests that the price will head lower, possibly towards the $8,700 area, which was the catalyst for the initial breakout.
Long-Term Movement
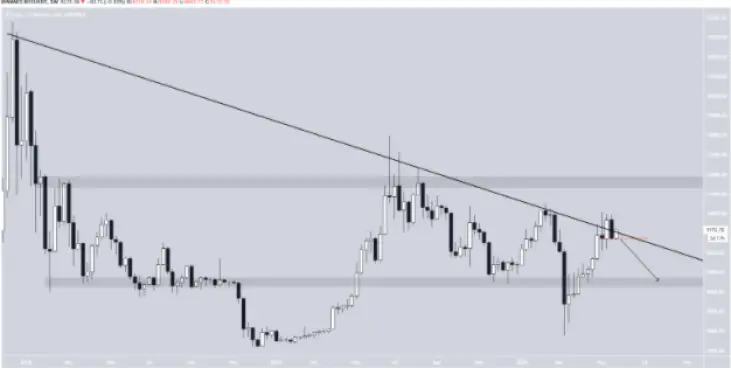
The weekly chart can be helpful in determining the future trend. While the price initially broke out from a long-term descending line that had been in place since the December 2017 high, it has fallen right back below it, creating a bearish candlestick.
The current week’s close will be extremely important in determining the direction of the future trend. A close below $8,700 would indicate that the price is heading lower, possibly towards $6,500.
On the other hand, a close above $9,600 would be bullish, confirming that the price has broken out from a long-term resistance line and likely cause it to move towards $13,000.
At the time of writing, the bearish option seems more likely.
What do you think we will see in the coming week / month? Do you agree with the above analysis? Also If you like this content, consider tipping the article / following me, so more people see this content and we get a nice discussion going on.
Also, If you are interested in trading, I would suggest you try out BeInCrypto's free Telegram chat. I am there and it is growing very quickly (over 3,000 members) where they discuss the market and share interesting content. They also have a free premium channel where they have a cryptocurrency trading course and daily trading signals. If you are interested, you can click here.
Until next time, stay classy crypto world!






