
According to our Latestest analysis on BTC, here is the link( Latest analysis of BTC for the remaining days of March 2021), Two scenarios where written out.
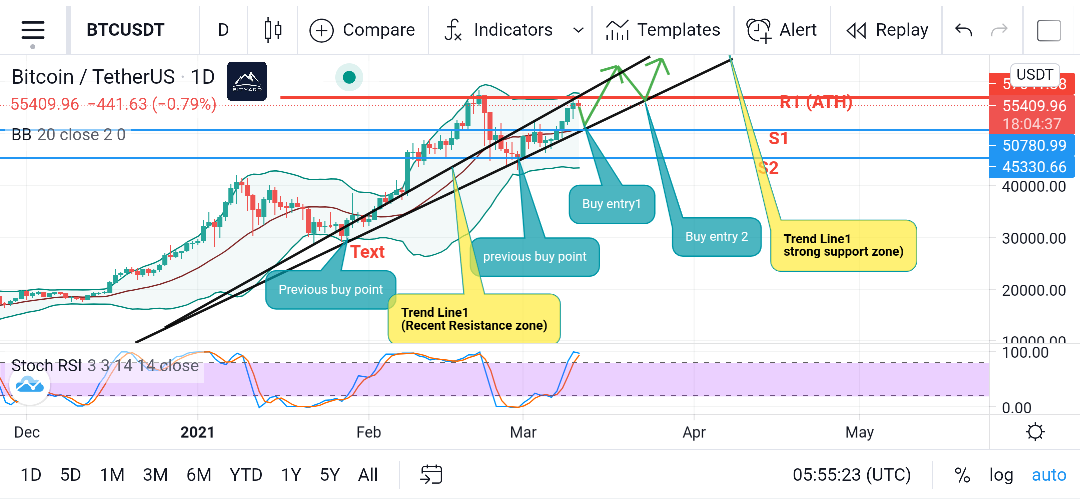
BTC has reach the first buy entry point of the scenario 1 (@$53,000, below is the chart from my previous analysis,
Current Bitcoin price as of th time of writing is $53,570
Secenario 1,
And here is the latest Live BTC chart taken at 5:44 UTC (16th March,2021).
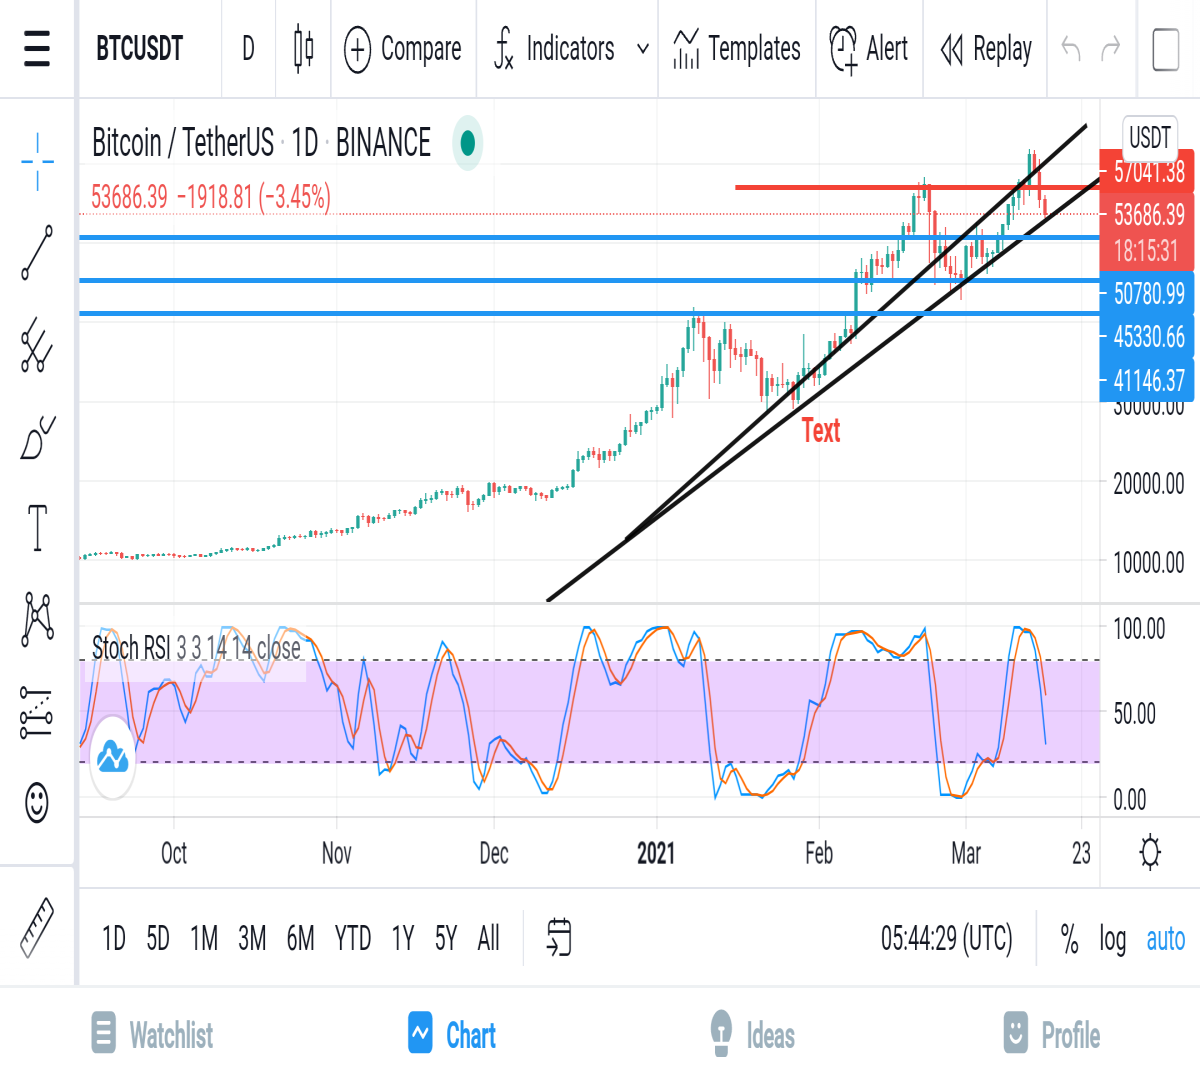
Our opinion, although BTC has reached the first Buy entry of scenario 1, the latest BTC chart still shows a possible downward price movent of the BTC.
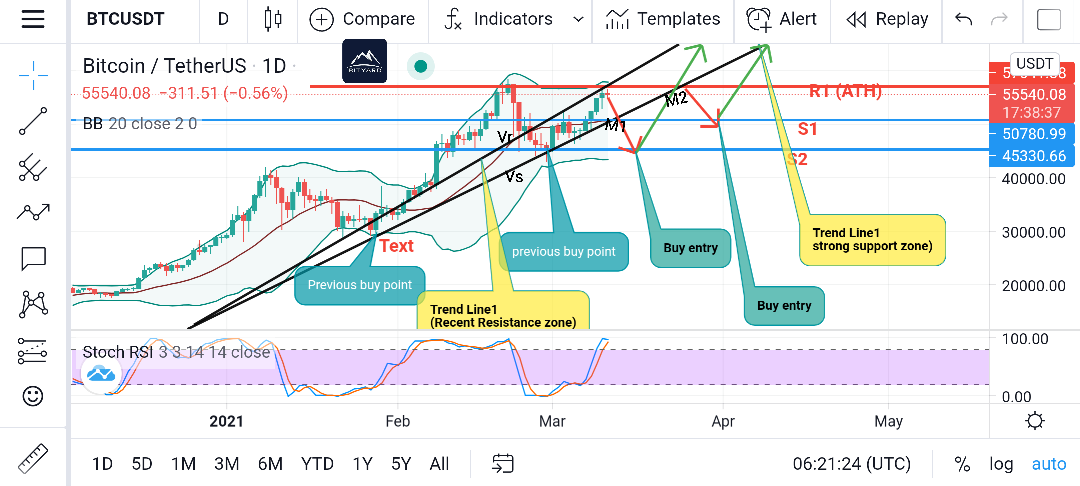
As can be shown on the latest BTC chart above, the first scenario is playing out so well, but on a close analysis the 2nd scenario will the the most likely outcome to play out up to 60% certainty. (Reason being that the Stocastic and Rsi shows a bearish movement of price).
NB; this doesnt mean that the 1st scenario that is playing out now can't continue, Infact the 1st scenario has a 40% chance of continuing.
Below is the chart for the second scenario;
In conclusion, Spot traders can spot trade BTC, and utilize the this first buy entry point and buy, for contract/future/Leveraged traders, there can also buy but they will always have in mind that the 2nd scenario is also likely to play out, so our advice is a very short term trading method( HIT AND TAKE).
TIPS; For contract/ future/leveraged traders, DONOT KEEP AN OPEN TRADE OPEN FOR SO LONG.(Reason RSI still shows a possible downward movement). UNLESS YOU ARE TRADING WITH THE TREND.
Article on proper trend identification will soon be available.
NB: This is just my own analysis not a business advice.
-
Disclaimer; Trading of cryptocurrency can be very risk use proper risk management.
Dont forget to subscribe to my website Cryptonalyzed for more crypto Analysis:

Dont forget to trade BTC at the world leading platform Bityard,click here to register and enjoy $258 welcome bonus.


