Yesterday's jobless rate and non-farm data were indeed a little surprising, largely because of an increase in claims data on the 4th and job losses that were announced, so that not only did the unemployment rate not rise, but it also fell. Moreover, the non-farm data were also higher than expected, except that next week's CPI data will be significantly lower than expected and the core CPI will change from rising to falling.
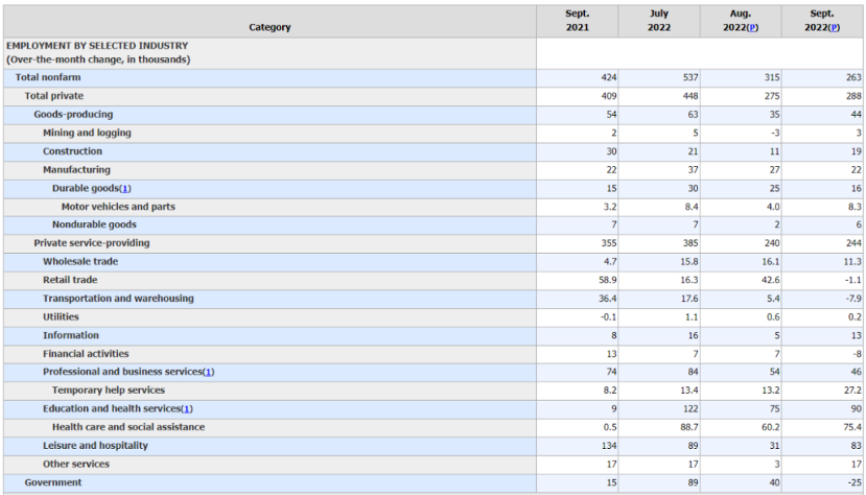
It is difficult to change the Fed's expectation of a 75-basis-point interest-rate hike in November, but the market's focus is no longer on November's rate hike. More and more people are now worrying about whether the October inflation rate will ease, especially since the employment data showed that food, services, construction, automobiles, and manufacturing, which account for the bulk of CPI, are adding workers, which also means higher costs. That is precisely not what the Fed wants. The Fed wants to reduce inflation by lowering the cost of production through job suppression. With the risky markets at loggerheads the other day, and the job markets at loggerheads the Fed, the Fed must be using the strength of non-farm data to show that there is no recession, and thus increasing its interest-rate hikes, including today's tweets from Nick, the Fed's mouthpiece.
In a tweet, he suggested that the Fed would raise rates by a total of 125 basis points in the next two rate hikes in 2022, which would bring the end-of-year interest rate up to 4.5%, as expected by the September rate hike. So the final call for a rate hike on November 3 is the September CPI data due on October 13, and the biggest uncertainty in this data is whether the decline in rents has been recorded.

After all, third-party forecasts now expect the CPI to be only 8.2% in September, compared to a margin of only 0.1% in August. Without the input of data on rent declines, there is still hope for next week's CPI. And if the forecast on rent changes has been added, let's not say that the core CPI is rising. Even the broad CPI is unlikely to be sure that this is due to a downward trend, and today the US Labor Department's forecast is out. Broadly similar to third parties, the Labor Department expects the broad CPI to fall to 8.1% and the core CPI to rise to 6.5%. All of these figures are lower than third-party statistics, which means that the Labor Department will be more optimistic about the decline in the CPI in September. Most likely, the difference will be in rent. So the message is clear now, as it was in the beginning, unless CPI is below forecast, or even below 8%, and core CPI is negative. Otherwise, it will be hard to shake the Fed's resolve to increase its rate by at least 75 basis points. And if the CPI number on the 13th is higher than expected, or even higher than third-party expectations. Even a 75 basis-point increase in November would not necessarily bring the year-end terminal rate up to 4.75%. Even a 100+75 combination cannot be ruled out. If this happens, it will inevitably have a big impact on the dollar index, which will continue to drag down risk markets. And the BTC and ETH, which are highly correlated with the nanofinger, will not be immune. So it can be said that the CPI data to be released on October 13 basically determines whether the current risk market, including the currency market, has reached the bottom stage.
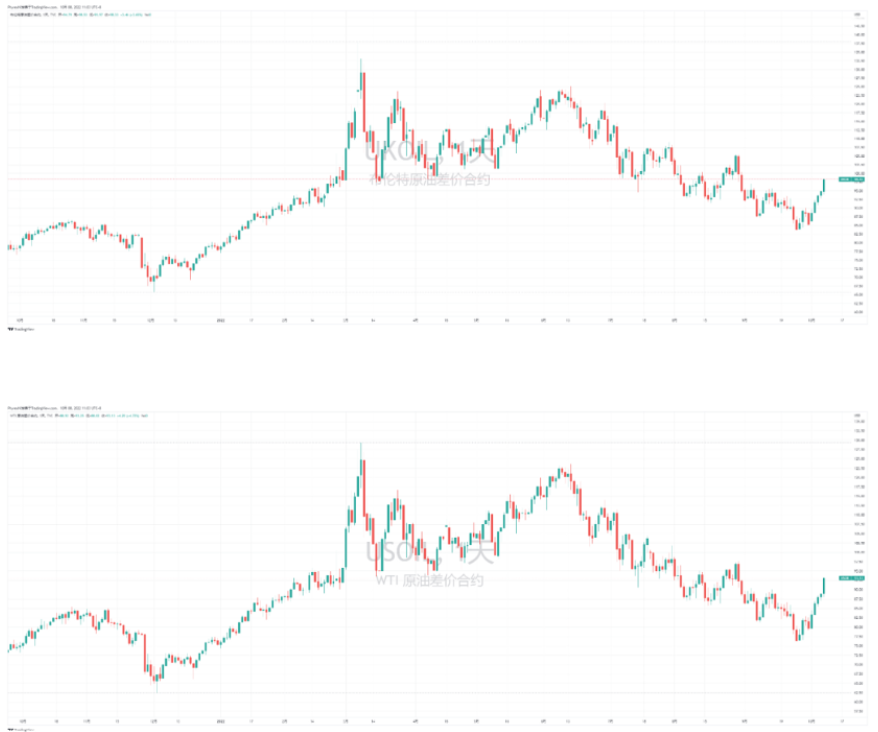
The October CPI data shows that the probability of a reversal has increased significantly from the current trend. On the one hand, from the oil price, it can be seen that the current oil price is basically the average value in September. Even the average value in August has already exceeded, so that it will fall not far from the average value in July. This directly strips away the three-month drop in oil prices. Basically, for every $10 drop in oil prices, inflation can be lowered by 0.4%. On the other hand, it is not difficult to calculate the impact of a $20 increase in oil prices on CPI. The US Federal Reserve is not blind. It will not lose sight of the current increase in oil prices. But does the US Federal Reserve have a solution? No! Even the US president, who has been crying out for nothing for two days in a row, could not resist the obvious flak that "Russia and Saudi Arabia are behind the rise in gasoline prices," and the markets were waiting for him to follow suit.
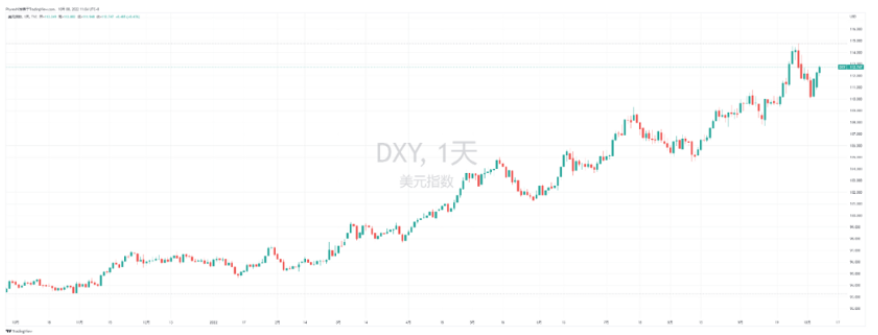
And there are other side effects, too, as the dollar index for the non-farm data jumped, at one point almost breaking 113, prompting another flight from US debt, just as liquidity had not been there for a second day, with yields even on one-month US Treasury bonds now approaching 3%, still no money to buy, but a flood of money out of the market, which is causing America's young people to reckon with a headache.
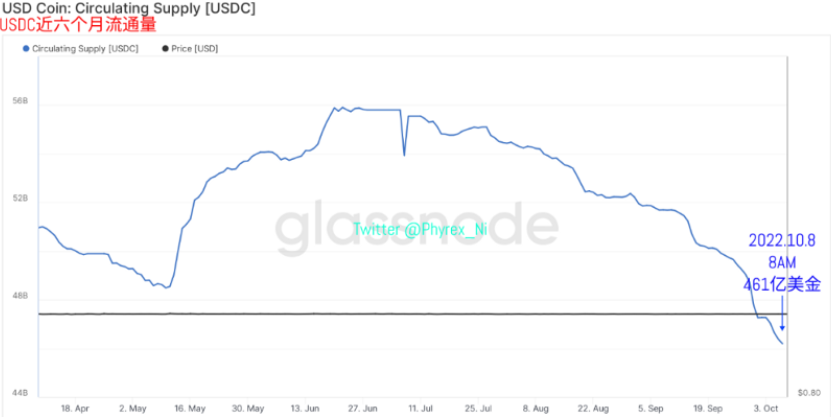
Of course, the headache is not just for the US Treasury market. For currencies, the continued decline in the market value of the stablecoins is also a headache for investors. The bad news is that USDC's market value has dropped again, and as of 8 a.m. this morning, about $180 million left the currency market via USDC, which is almost exactly what you would expect, because investors are losing confidence in the current risk markets with the strength of non-farm data and the rising price of oil.
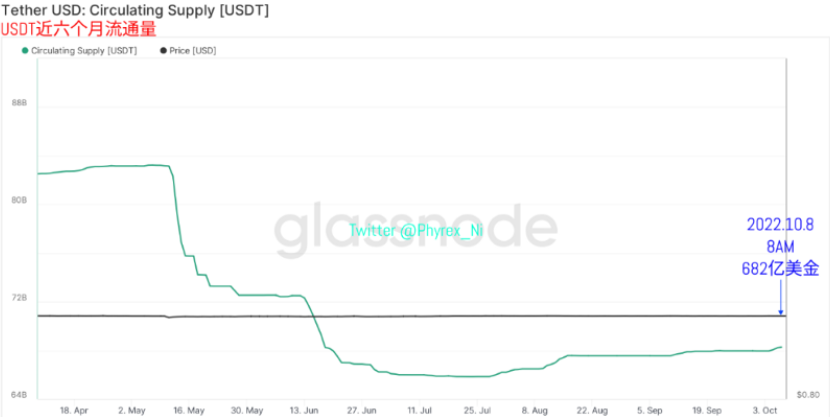
There is good news, though: while the reduction in USDC's holdings has reduced the overall market value of the currency, USDC has been out of the driving seat for a long time, and even a reduction in market value will not have much of an impact on volume. But for USDT, which was the dominant trading firm, the change in market value was critical, and USDT's market value rose, albeit only slightly, to $50 million.
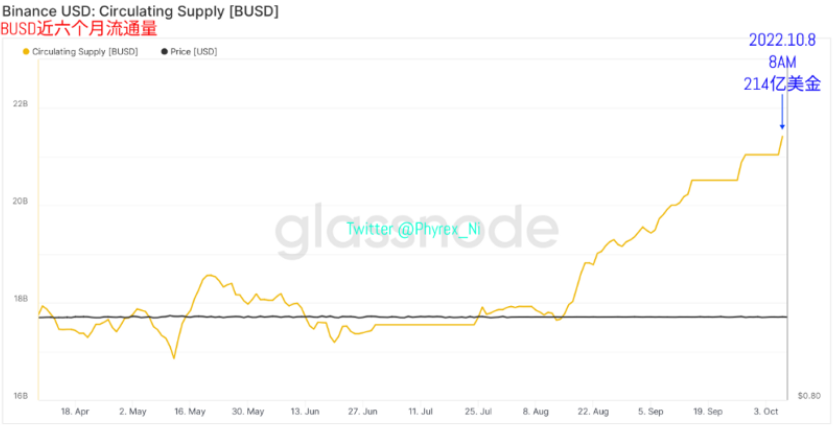
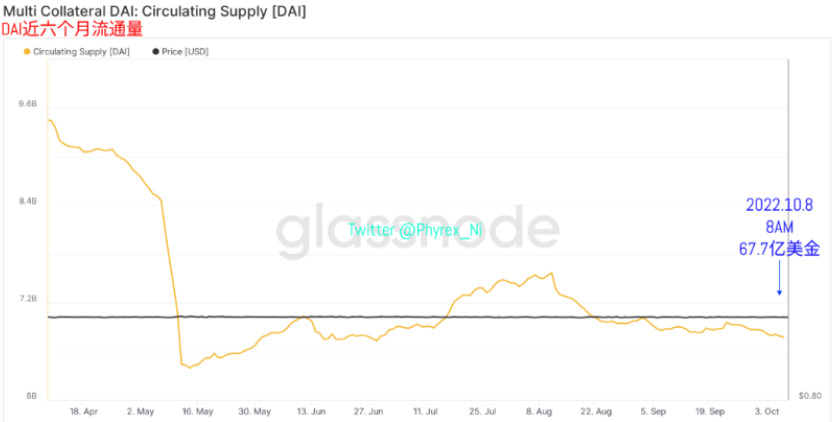
In addition, the market value of BUSD, a secondary trading force, rose by nearly $400 million by 8 a.m. this morning, the largest one-day increase in recent history, pushing BUSD's market value to $21.4 billion, giving the pessimistic market some momentum. DAI, a gage of the ETH's physical leverage, is still trading at a lower market value, but it is not the main force of the trade and has little impact.
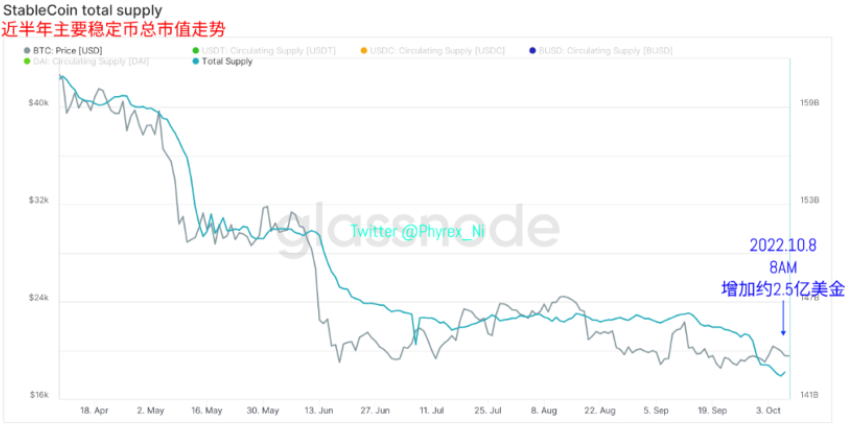
So in general, the market value of the stablecoin today is still being held back by USDC, but the increase of the two major trading partners, USDT and BUSD, has led to a rare increase of nearly 250 million US dollars. Especially since the market value of the USDT has been increasing for two consecutive days, this also shows that Europeans and Asians are increasing their investment in risk markets, even if the current situation has shown that this may not be the bottom of the stage.
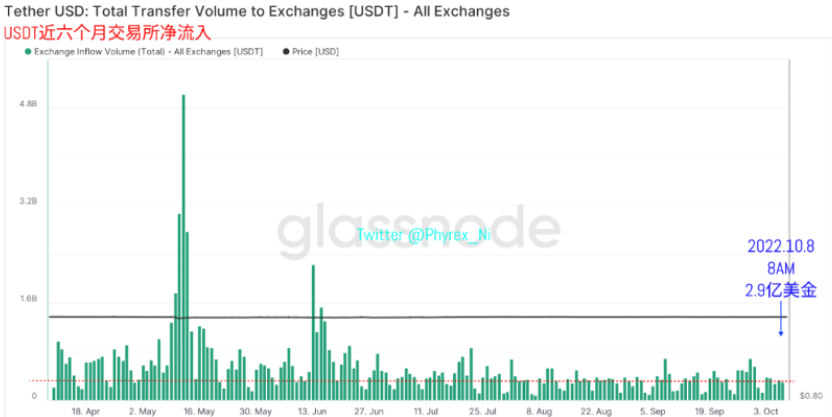
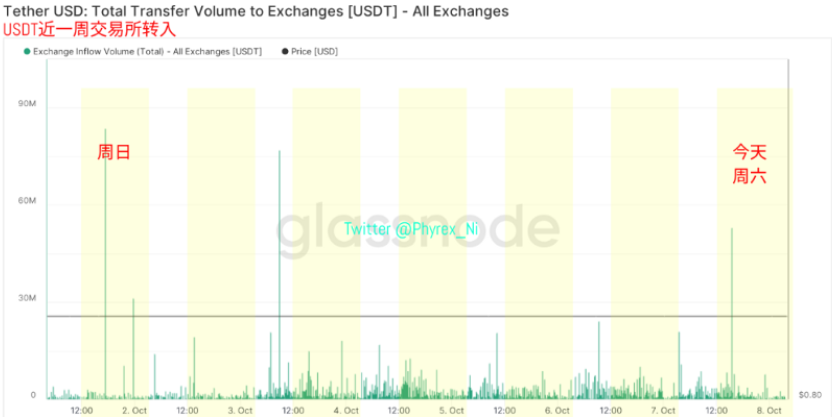
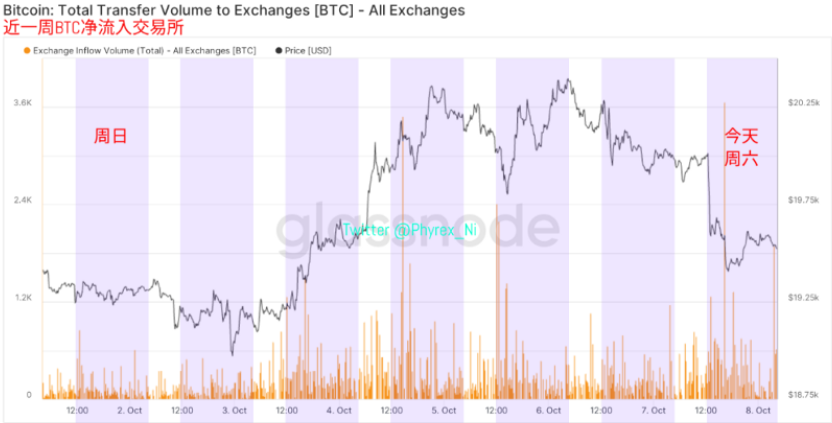
And although the BTC and ETH prices are decreasing along with the trend of the Nasdaq futures, but USDT who is keen on "buying at the bottom" has not missed the opportunity of price decreasing. Looking at the amount of funds transferred to the exchange at 8:00 a.m. as of this morning, purchasing power has slightly decreased, but the amount of reduction is not large, there are still many USDT turning into purchasing power. The European time zone is still the main force of the trade in terms of the amount of time that has gone into it.
ew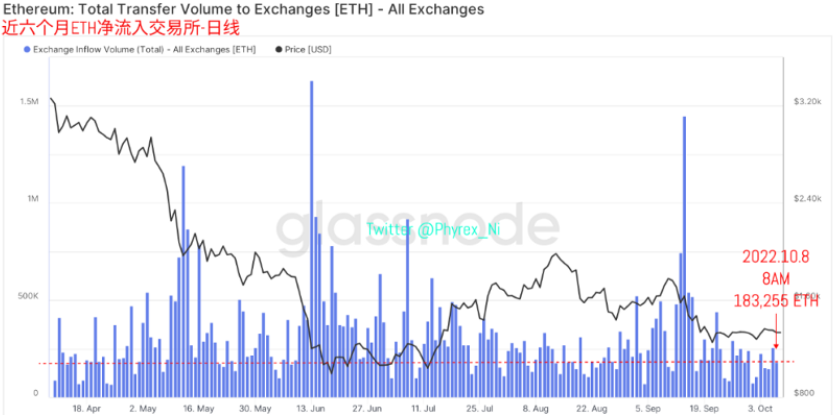
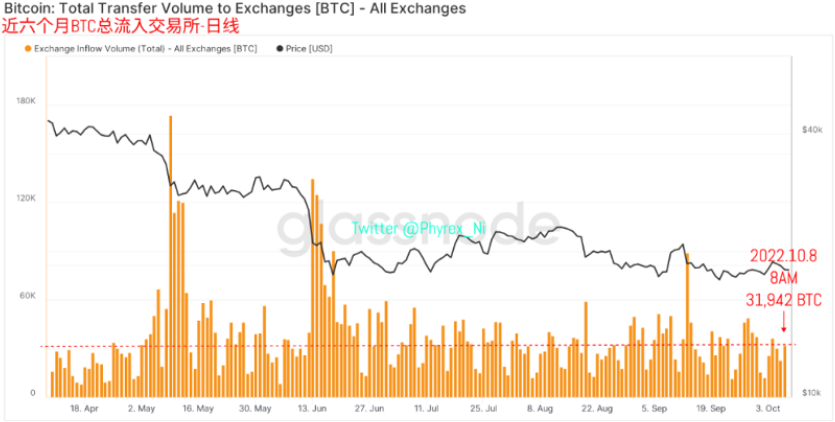
However, from the selling pressure into exchanges, first the BTC showed signs of selling pressure increase. The selling pressure that had already been stabilizing and reducing was also greatly increased, stimulated by the non-farm and unemployment data. This also represents more investors are not optimistic about the next currency market trend, while the ETH is opposite. Instead of increasing selling pressure, it has also seen a relatively large reduction, indicating that more investors are not eager to sell.
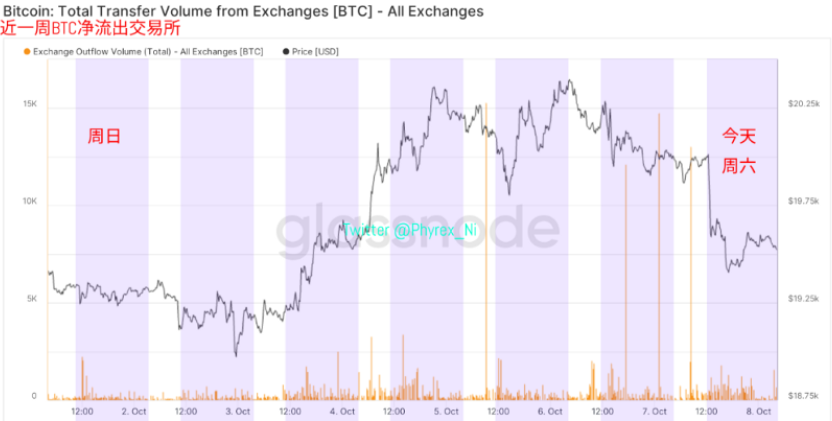
The increase of selling pressure has indeed improved the data from the exchange, but there are some things can only be found with details here, although the BTC cash withdrawal is high, even perfect coverage of selling pressure, but from the details of the data, more cash is in the non-agricultural data comes before, but non-agricultural data after the emergence of a larger scale selling pressure, but the cash has not increased significantly.
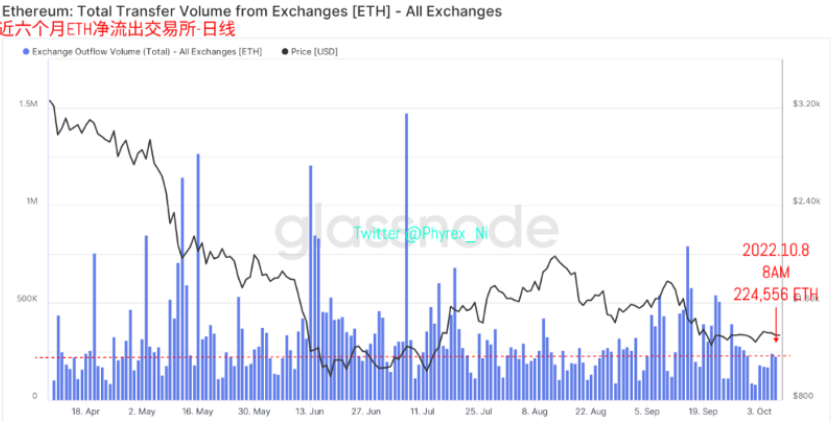
This means that BTCs which actually transfer to the exchange after non-farm data are more or less stuck in the exchange. Relatively speaking, although the amount of ETH withdrawals is small, it can still cover all the selling pressure. Also when the price falls, there are a lot of signs of chips leaving, which shows that more funds are buying low ETH, and many selling pressure into the exchange can not be excluded that exchange hot and cold wallets exchange.
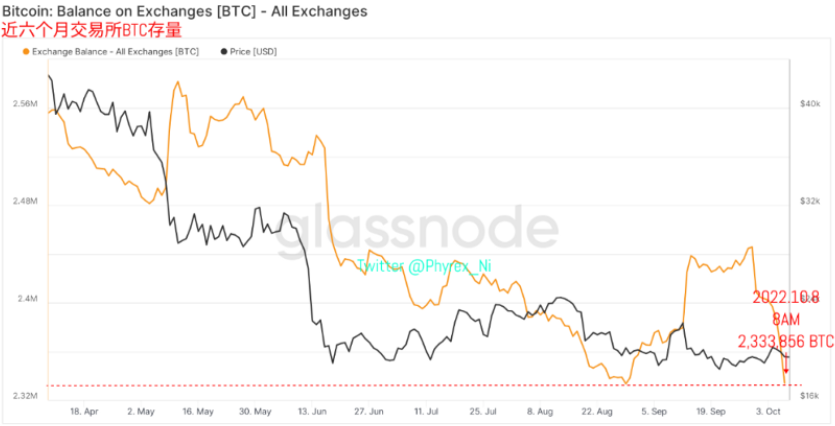
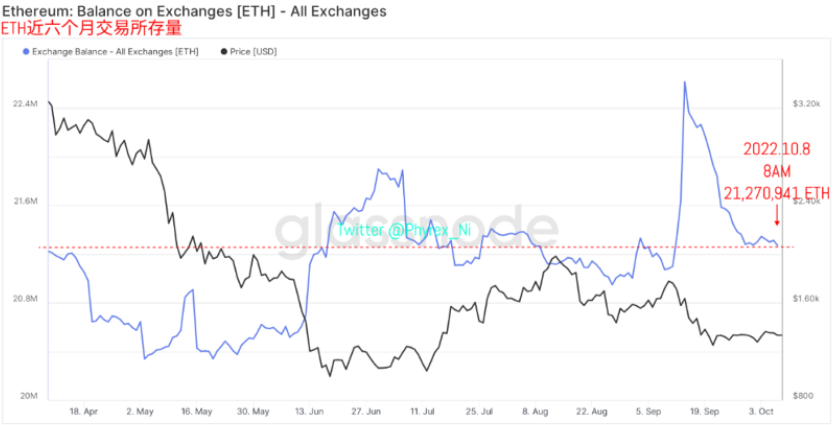
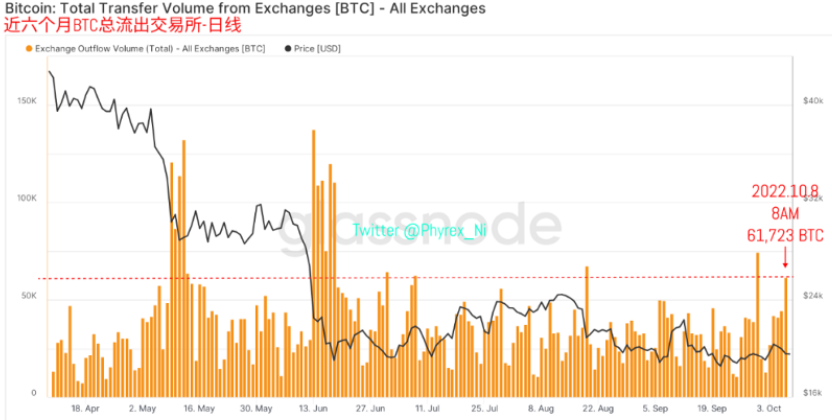
From the stock exchange can be found, although the BTC stock is really in a state of reducing holdings, but from the details of the data can be found, the main force is before non-agricultural data, non-agricultural data after the emergence of no significant change, while ETH is the opposite, although the reduction in stock is not much, but with the emergence of non-agricultural a lot of chips leave the exchange.
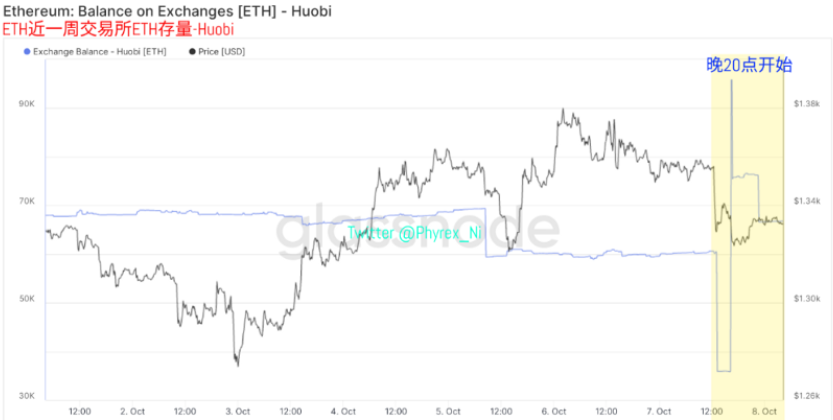
The next 60,000 additional ETHs entered the Huobi from the outside, and although nearly half of the ETHs were removed from the field, half remained in the Huobi, and of course it was difficult to determine whether this was the user's ejection or not, but the first 20 minutes reduced more than 20,000 ETHs, and the next 10 minutes reduced 10,000 ETHs, and there were no ETH transaction pins for the Huobi, which was not the user's behavior.
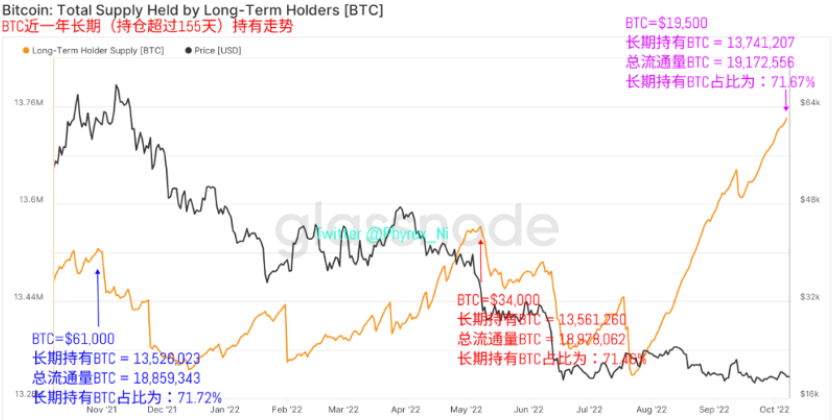
In the long-term BTC market, although the recent price fluctuations are large and the expectation for the future market is not ideal, the long-term holding chips show no sign of leaving the market. On the contrary, more BTCs, which are already losing a large amount of money, are not involved in changing hands. As a result, more chips are shifting into long-term holdings, either actively or passively. The proportion of long-term BTCs in the market is close to its record high, and could reach at any time in recent days.
Finally, from the emotional aspect, although the current trend is not good looking, especially the strong non-farm data and the unfavorable CPI expectations, even the BTC has changed from the trend of large area bullish to the state of the long-short game, and there is no obvious trend, at any time in the bullish and bearish interval switching. Instead, the ETH has been more pragmatic this time, changing with prices, and showing no strong expectation in one direction. In summary, it can be said that at present it is already extremely unfavorable to the risk market, especially after a volatile evening, it is difficult to say that the Nasdaq has already stopped falling. After all, as Friday ended, there was no movement in the Nasdaq futures market. After losing its reference point, it could only be known about it on Monday morning. The Nasdaq is hoping to recover its poise after a cool-down weekend, and third-quarter earnings reports from the stock market will follow as Monday begins. Judging from the data currently available, all kinds of problems have occurred among the bellwethers of technology stocks. Therefore, starting next week, the situation is expected to be even more unfavorable to the movement of the risk market. Moreover, next Thursday is the moment to release the September CPI. Before that, even more caution is needed. It is quite possible that this is not the bottom of the risk market. And high leverage in one direction is riskier. Keeping the cash on hand and not shrinking is the way to go.


