The price distribution of BTC positions as of 13:00 p.m. today is 15 hours from 22:00 p.m. yesterday. A little sleepy today, so the selected time is a little longer, but even longer data time, the amount of chips in this period is still very low, the total number of incoming is only 17,600. Less than 550 of these have been profitable chips with positions held for more than half a year, as well as BTCs that have been held high. On average, there were only 36 reductions per hour. Overall loss chips, which are more than a month above $25,000, are fewer than 1,750 BTCs, an average of 116 per hour, a lower category even over weekends. So it continues to be seen that weekend circulation remains scarce, and because of that, it is clear that prices are unlikely to fall significantly when earlier chips are not in circulation. Relatively speaking, more selling pressure is still in the current dispute price, especially when the price of BTC upward trend is more obvious, more cuts are from the bottom of the profit chips, but still can be clearly seen, compared to the workday at more than 100,000 changes, only 17,000 BTC fluctuations are already very little, this represents the real "users" changing hands, and the workday mixed with the consideration of too many institutions. And with the "inaction" of the earlier BTC positions, more chips are in the quiescent phase, with the most immediate consequence being that the amount of liquidity in the market is starting to go down. While this will not have an essential effect at the moment, if you take a longer-term view, each passing day is now closer to halving the BTC's value in 2024, and that halving will be accompanied by a Fed rate cut. So whether looking at macro, seeking swords, or even looking at convictions, 2024 is something to look forward to, so why should we leave now without knowing what's going to happen in the short term, leading to being thrown off the train? Instead, the mindset of getting 15 months at most is the one that resonates with long-term holders today. From the front side of the analysis, it can be seen that even the July CPI and July rate hikes appeared without triggering movements among long-term holders. This means that these long-term holders of BTCs are now almost bored with current prices, and with significant downturns and long swings around $20,000, the chips are almost gone, and the rest are almost always active or passive long-term holders. Cruel as it may be, the scarcity of circulation at BTC is holding back a sharp decline in prices for the time being.
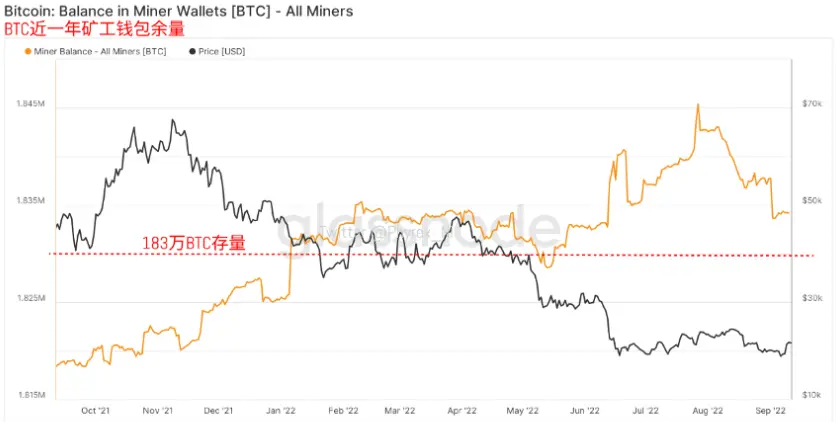
For another miner selling BTC, the previous period was a time when miners were shipping more, especially when prices were persistently low and volatile, and when the price of miners almost hit the shutdown price, early thought that the price would rebound quickly, even when many small miners were willing to dig in despite their losses for a while, but found that the price rebound was almost ineffectual or even dropped back to $20,000. The miners' chips are being drained, if not sold, as collateral. As the price rose back above $20,000, the miners' selling abated. But the biggest change that is likely to come now will depend on the Fed's September rate hike and its decision over the year's terminal rate. At 75 basis points and 4%, the miners' misery has not yet begun.
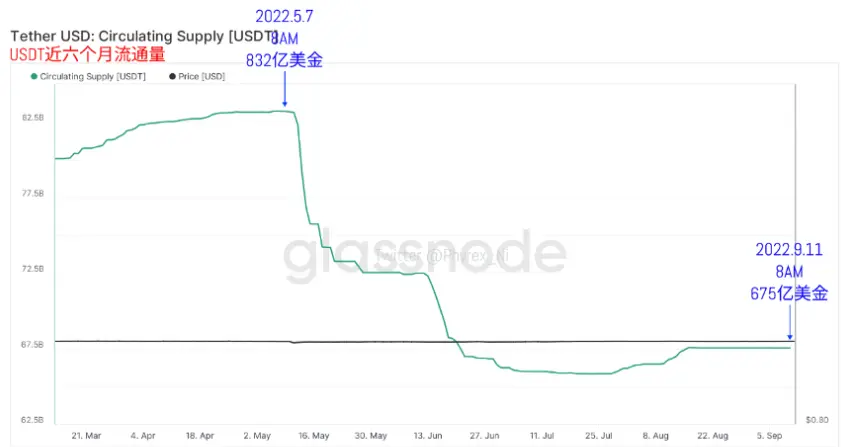
When selling pressure is temporarily suppressed, the trend of capital volume determines the direction of the development of the currency market. Only when more external capital enters the market can it represent the growth of more investors optimistic about the future of the currency market. But if external capital continues to flow out, it is still a little early to say the bottom. Judging by the amount of money USDT has, it continues to be at a level. Still, it shows that external money in Europe and Asia remains on the fence.
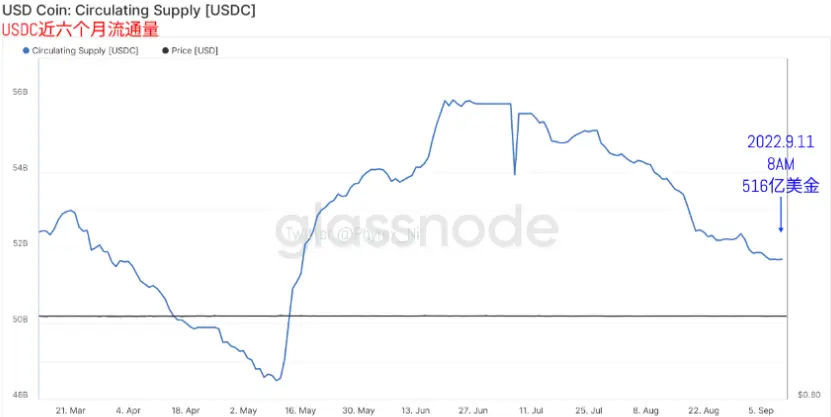
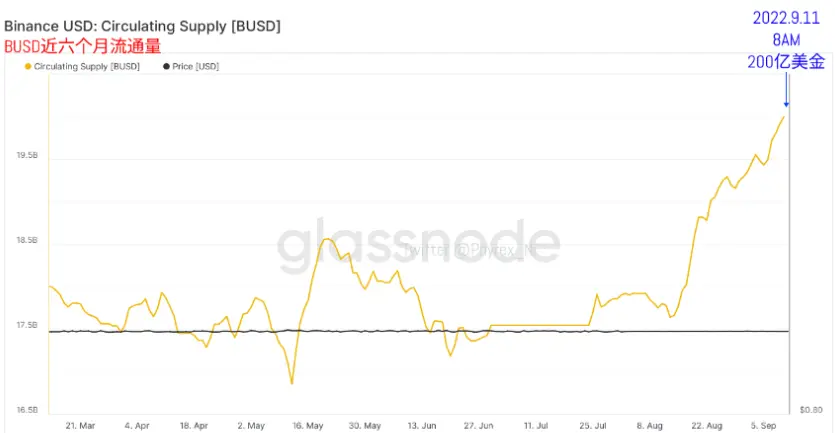
For USDC, which has been on a downward trajectory, the weekend was also a rare moment of calm, with the company's market value even edging up by about $10 million, but it will not change Circle's current predicament, and the plans for a public listing may need to be given some more thought. And now the winner, BUSD, has broken through the $20 billion mark to become the largest ever, and the winner of a three-month-old war over the stable currency.
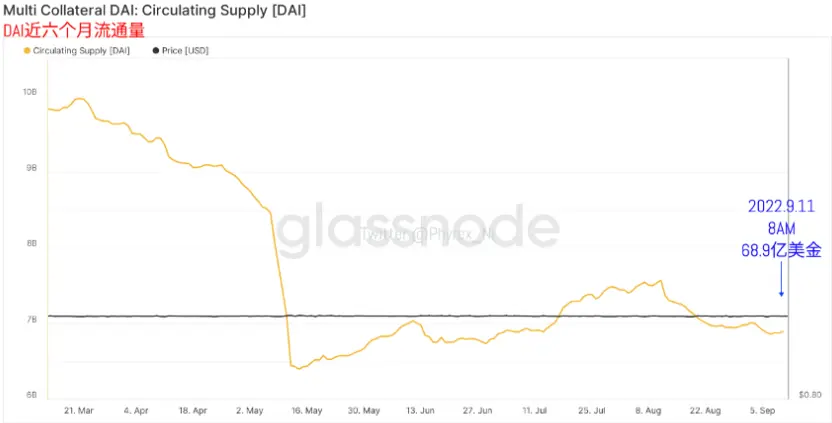
With the ETH price rising, the increase in DAI's market value was expected, especially as the increase in the pre-merger price reassured many speculators that the ETH price had already started to decline, leading to an increase in cash ETH circular arbitrage not only in purchasing power, but also on the MakerDao collateral. However, this trend was influenced more by post-merger short selling than price. Therefore, from the perspective of the overall stablecoin market value, USDT, the main trading force, can only maintain a relatively low level of on-exchange capital purchases at present. Neither external capital nor more on-exchange capital suddenly ended up in the market when the situation was unclear. BUSD replaced USDC's status by relying on Binance's BTC and ETH zero-fee activities. Moreover, the market value of over 20 billion also indicated that there was indeed external capital coming through BUSD.
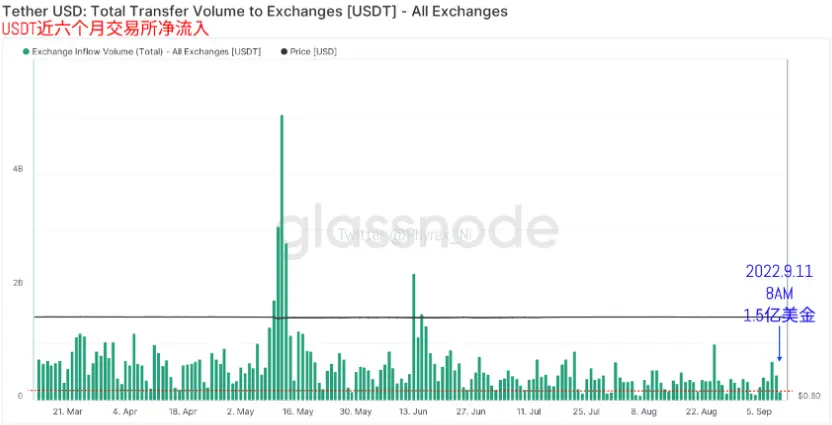
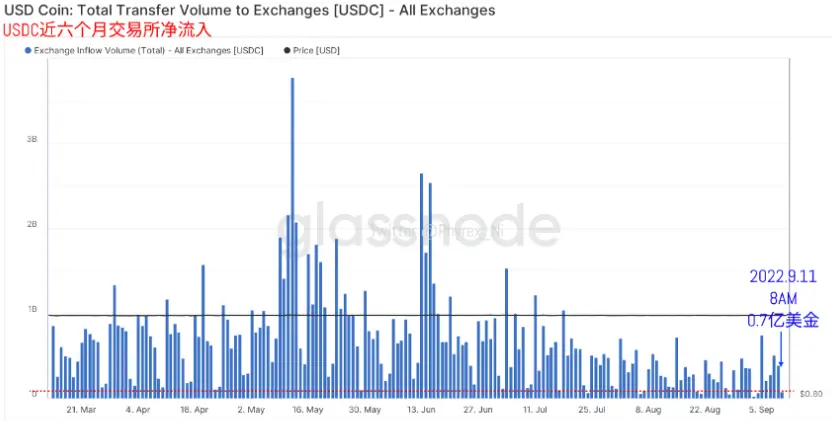
However, purchasing power has been relatively pessimistic, and of course this is because selling pressure has also been greatly reduced so that prices remain at their current level. As of 8 a.m. this morning's data, it can be seen that money going in at USDT has continued to be the same as it has been at weekends for nearly two months, and that money going in at USDC, although similar, reflects the current level of American attitudes toward the currency market.
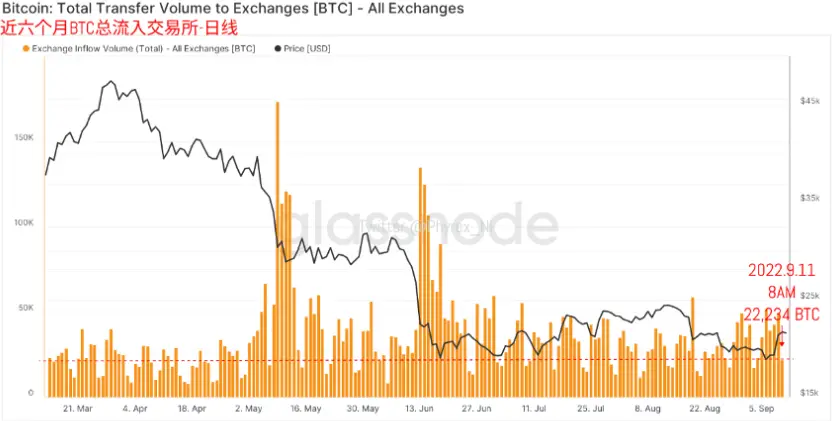
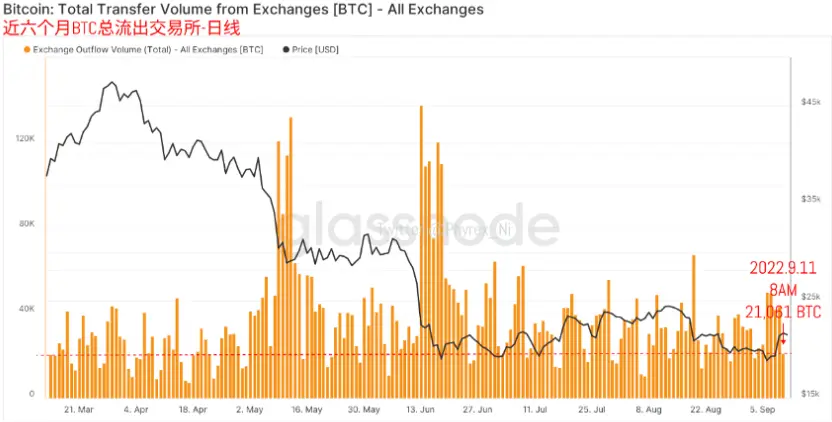
The selling pressure transferred from BTC to the exchange and the withdrawal data from the exchange show that there is a relatively large decline in the weekends. Whether the selling pressure or the withdrawal data from other relatively recent weekends show that the selling pressure is still at a relatively high level, but there is no corresponding increase in the volume of transfers. This has caused more chips stay on the exchange and may cause some instability.
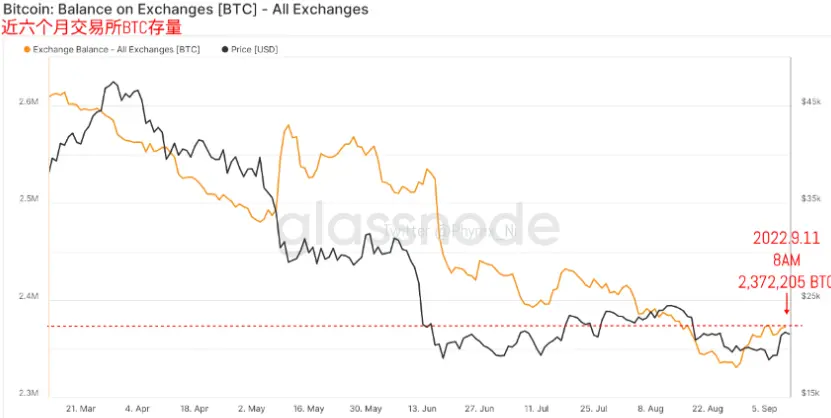
BTC stocks in the exchange can also be found, compared to the previous day, the inventory increased by more than 2,000 appears, although the amount is not a lot, but also proved more chips or initiative, or passive stay on the exchange, considering that the mid-autumn festival is the release of CPI data, more chips moved to the exchange ahead of time to prevent price collapse, which is normal. Don't worry too much, stocks are still low.
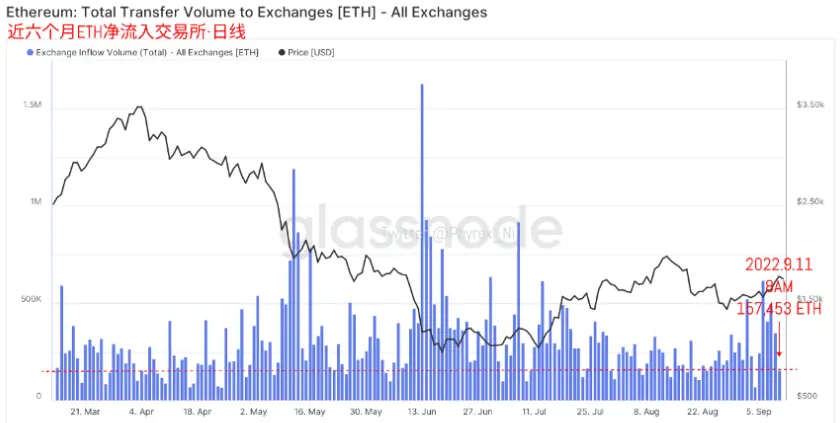
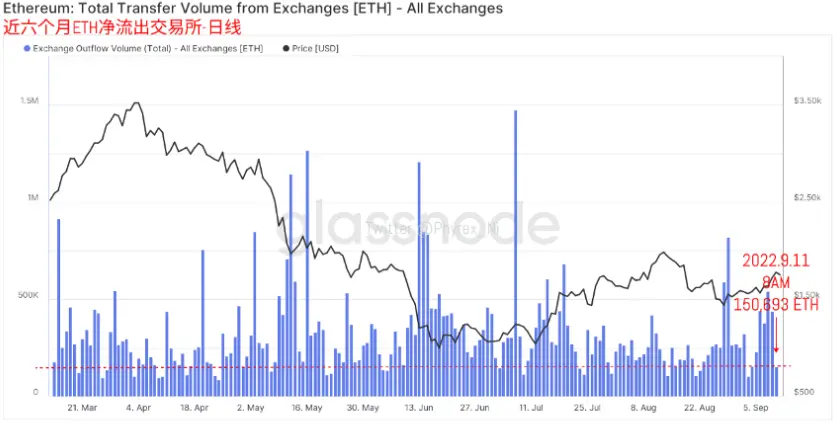
Compared with BTC, the trend of ETH is similar. The amount of selling pressure transferred to the exchange is not much different from that in recent weeks. This also shows that the merger of ETH still has a great impact on selling pressure. But the amount of withdrawal data transferred out of the exchange has a little bit failed to keep up. Although the difference is not much, it also appears the same stagnation as BTC, but the overall impact is also a lower category. The increase in ETH inventory from the previous day was about 8,000, which is negligible. And, like BTC, the current ETH inventory is also in the low-middle range of recent history. A slight increase would not cause too strong a price change, but could be affected by consolidation as well as CPI. The timing of the airdrop could be the biggest. Another is the emotional side, as I will repeat many times every week, the situation at the weekend is low circulation, in this case, a small amount of chips can be smashed, a small amount of funds can also pull the market, short-term inflation and collapse are possible, even can not use the weekend price to balance the main force after the return of the situation, so the weekend even more up or down, it does not represent the so-called support point and resistance line. On the emotional side, the BTC continues to move in a pragmatic direction. While the long and short sides have their own losses, there are still opportunities in general, and even the losses should not be large. But in the case of ETH, the bears continued to show a large area of high-intensity bearish activity. Many of my friends asked me if this was due to a hedged situation, which is not to be denied. But what leverage is expected to show is an average of at least 20 times leverage, and there is nothing to say about such hedges. By the way, speaking of the small partner who is not sure about the data in the chain or the macro-emotions, I am also looking at a large number of other analysts' data to study every day. With all due respect, the accuracy of your own psychology is good, only someone gives you a point and you don't need to think. I'm sorry, I can't give you that, but if you can read broadly and make your own judgment, you can't say how much money you're going to make, but you're certainly less likely to lose money. Also, some friends left me a message saying how to judge the BTC's "blood sucking" situation. In fact, here I have a trick. That is, when the BTC suddenly surpasses the ETH, if it is in a non-weekend state, it must be a large amount of money purchasing behavior. At this time, it depends on whether the volume of transactions increases by more than 20%. If it exceeds, ALT is more dangerous. After all, the overall amount of money has not increased significantly. If BTC trading volumes soar, it could well be that money has left the ALT to buy BTC instead. This is commonly called "blood absorption," but in fact it is the same case for many times when the BTC falls significantly. Even if ALT does not move for a while, the likelihood of a subsequent "fall" is very high. Of course, that's just a personal opinion, and it doesn't necessarily make sense, so interested little people can talk about it.





