The Jinshi Finance and Economics has been updated. As one of the most convenient access channels to the domestic macro-information, Jinshi Finance and Economics can solve more than 90% of the information acquisition needs. Updates are at the bottom of the body.
A. Key macro analysis tools — — Tradingview It's probably the best free tool in the K-line world, and there's a paid version, but for someone like me who just looks at the lines and doesn't draw them, free is enough. Especially listening to the Twitter pals say that the Black Five also has a fold-out event, so if it's really necessary, Black Five is buying one, which is free, at least for now, which I've been using. And the most convenient thing about Tradingview is that it can observe more data at the same time, just need to know the exact code.
Macro data:
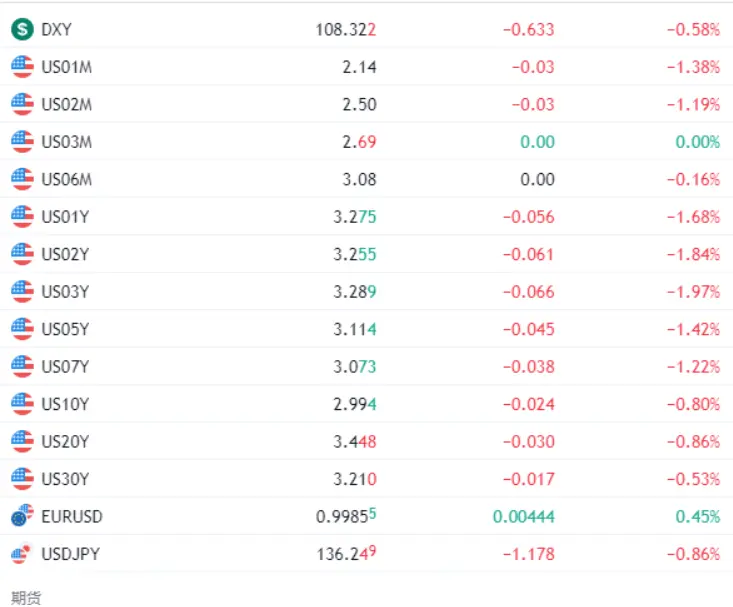
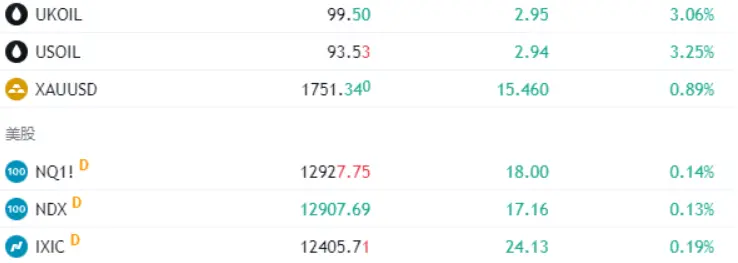
Since 2021, when the US Federal Reserve began a bear market in risk markets, expectations that the Fed would raise interest rates began, currency markets, which have little to do with the US economy, have become highly correlated with the US Nasdaq, mainly tech stocks, and as the Fed's move to raise interest rates has moved the macro-emotional landscape, it is also affecting the amount of money in the currency market, and thus the direction of prices. So, at the current stage, it's OK not to look at the K-line, not to look at the data in the chain, but if you don't understand the macro-mood changes, then you have to be prepared to hold on a long-term basis, or you will be stuck in a passive situation.
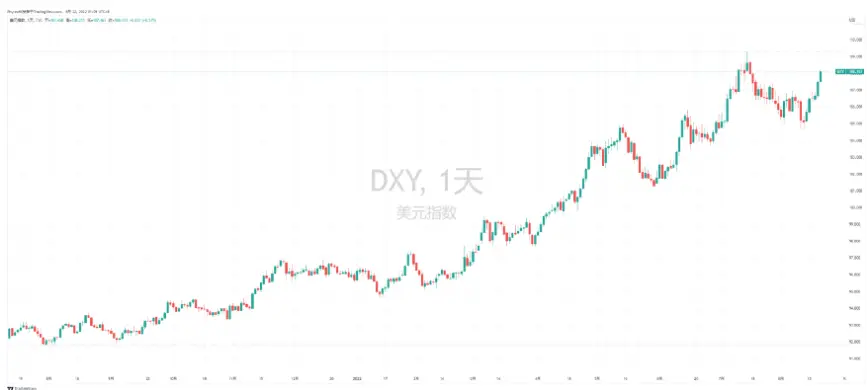
1. In the macro data, the dollar index (DXY) is one of the most important link, the value of DXY is equivalent to the "value weight" of the dollar. It can be simply understood that when the value of DXY increases, the dollar becomes more valuable before the investors' first choice is to hold the dollar or invest in its equivalent assets, such as U.S. Treasuries. And when that figure falls, it points to a release in the value of the dollar, at which point more investors will choose to move money into risky markets such as non-ferrous metals.
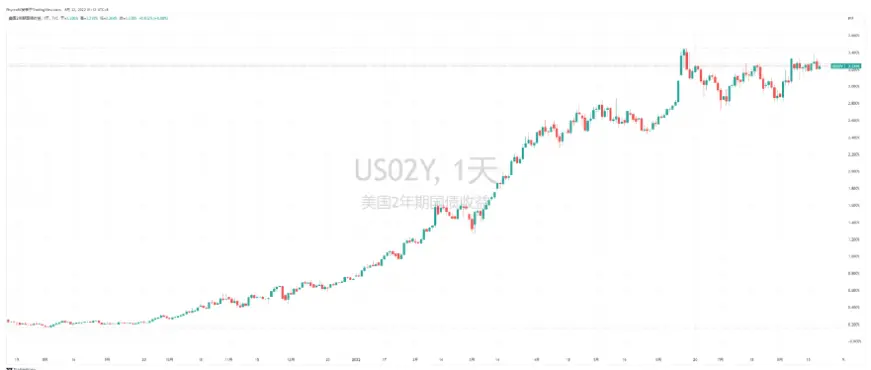
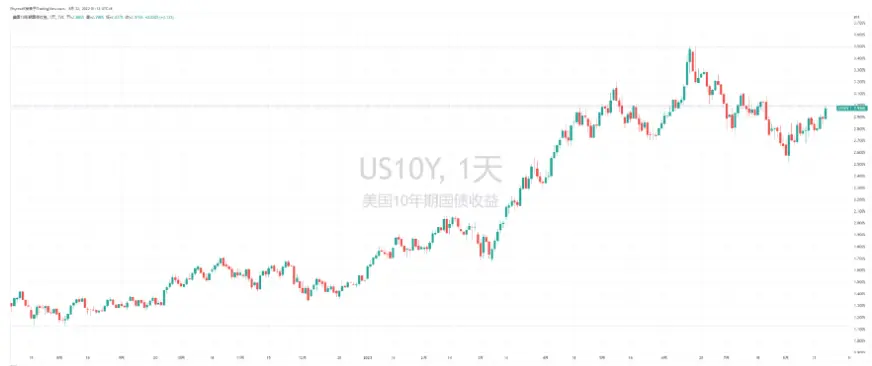
2. United States Treasury is the dollar equivalent as mentioned earlier, and United States Treasury bonds have maturities ranging from one month to thirty years. In particular, United States Treasury bonds for the two-year period are almost a market reaction to the United States Federal Funds Rate, meaning that the performance of United States Treasury bonds for the two-year period can basically determine the market's estimates of Federal Reserve interest rate increases. Ten years of US Treasury bonds are the anchor. In particular, the interest-rate spread between two-year and ten-year Treasury bonds can reflect the direction of the US economy. Since 1976, the US economy has been basically recession-proof in the event of an inversion, especially if the inversion occurred over a period of time. Most historical Fed officials would stop raising interest rates, which is why economists have dared to challenge the Fed. But this time, the Fed seems to have got its act together. So a minimum of two and 10 years of US Treasury debt is worth noting.
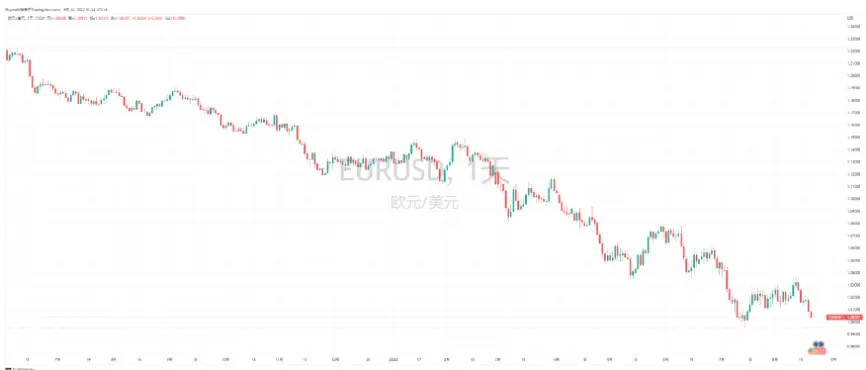
3. The exchange rate between the euro and the dollar is one of the important weights of the dollar index DXY. Especially now that Europe is facing serious inflation and the whole euro area is beginning to carry out interest rate increase, the exchange rate between the euro and the dollar can basically control the change of the dollar index. Especially now that the euro has started to weaken, it is likely to trade below 0.98, according to commentators.
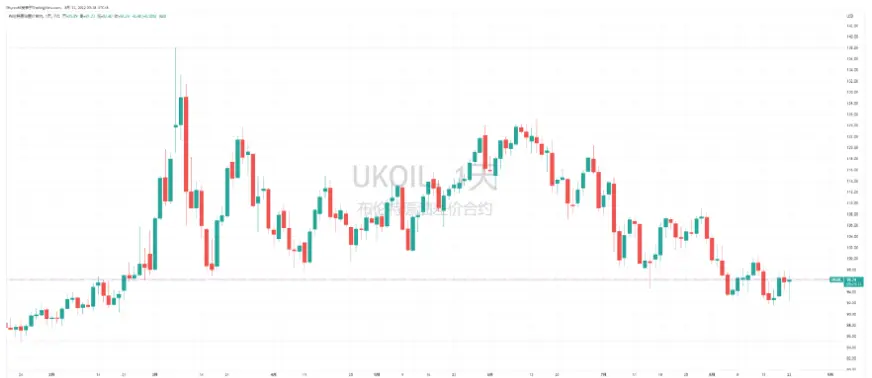
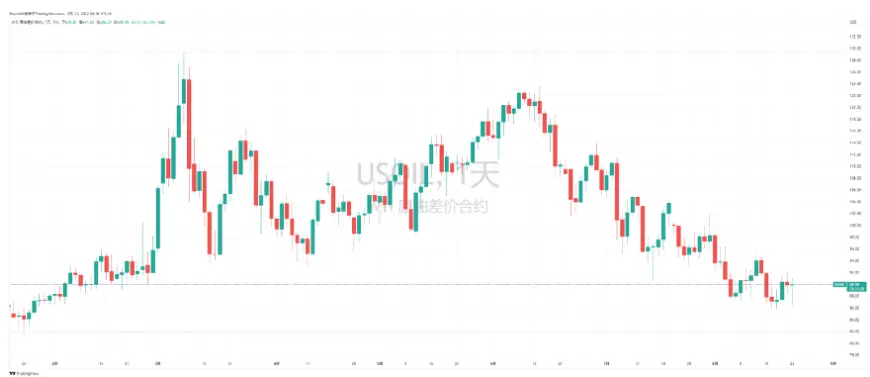
4. It is also said that inflation is the main reason for blocking the development of risk markets. The Federal Reserve's interest rate increase is also the cause of inflation. And while the oil price is not a big part of the inflation calculation, it has a lot to do with oil prices. After all, the United States is a "nation on wheels," so looking at oil prices is a good predictor of inflation. For example, the CPI released in July was down 0.6% because of falling oil prices. Compared to July, the CPI was down a little in August, so it is expected to be down, at least in energy terms.
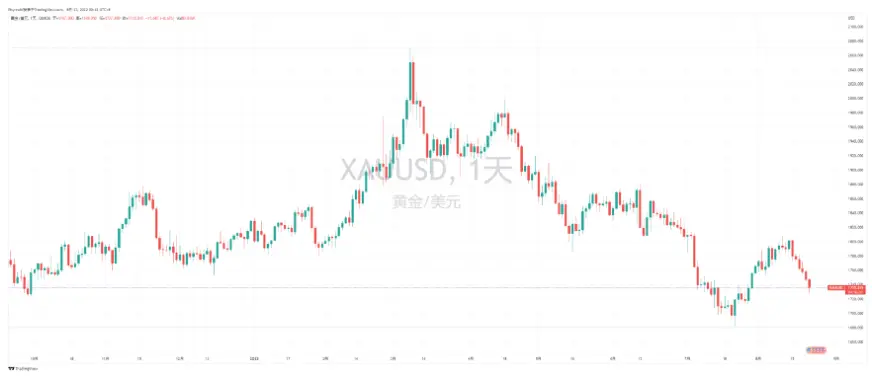
5. Although gold does not move in direct relation to the currency market, the price of gold, a bellwether for both inflation and the dollar, is forward-looking and, in a nutshell, it is difficult for the BTC to break out of a long independent market if gold is in a downward path.
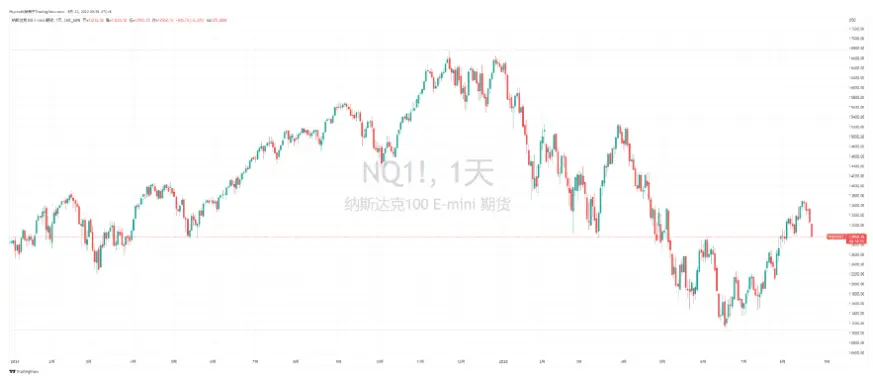
6. If the front is biased towards macro trends, then the Nasdaq futures are even more biased towards daily post-opening price forecasts, unlike the Nasdaq futures, which operate 24 hours a day, excluding holidays, especially when the Nasdaq is closed. And the Nasdaq futures also have a guiding role in opening the Nasdaq. If the Nasdaq futures are in a falling state before the market, the Nasdaq will open lower and vice versa. The Nasdaq is highly correlated with the BTC, so it is difficult for the BTC to break out of a freestanding rally when the Nasdaq falls.
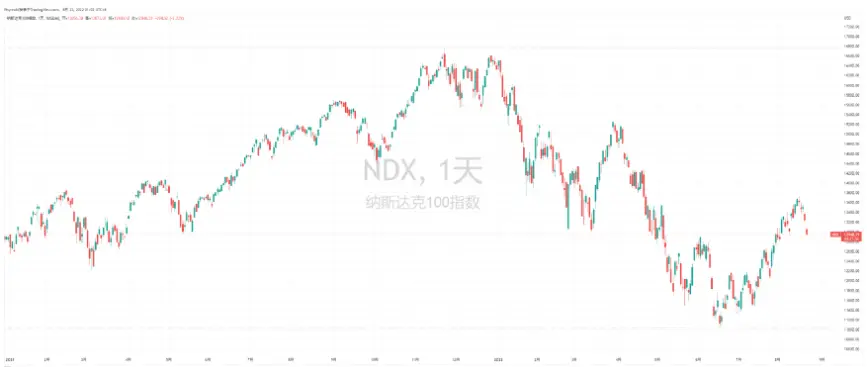
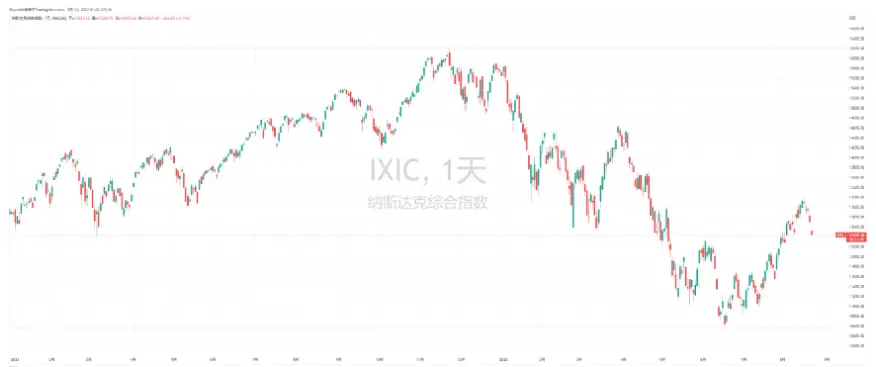
7. The NASDAQ 100 and NASDAQ Composite are nothing further. While the consistency has weakened somewhat since July, it remains stuck with the Nasdaq, especially when the Nasdaq falters, as will the BTC. After all, the investors in the back are still highly overlapping. So a Nasdaq indicator is as much a must-have as a BTC price. Data from the digital currency area:
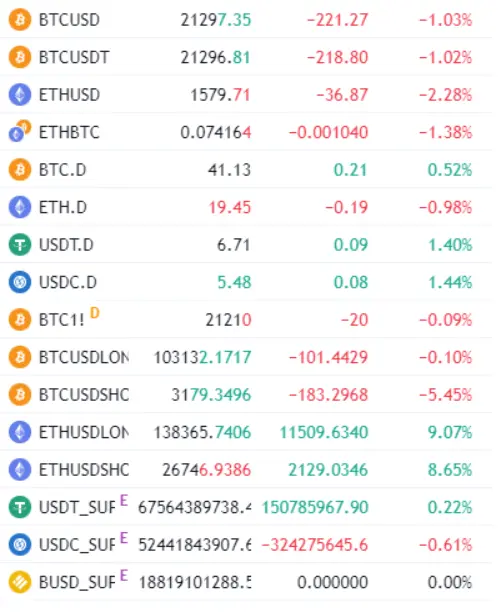
If the first seven items have no direct relationship with the currency market, then the eighth item begins to be understood and mastered by all the small partners in the currency market. Some of these data can help to judge the position of the big cycle of the currency market, and some of them can judge the change of the current long-short sentiment. Especially, the market value of the stable currency is almost the main basis for the bull and bear judgments.
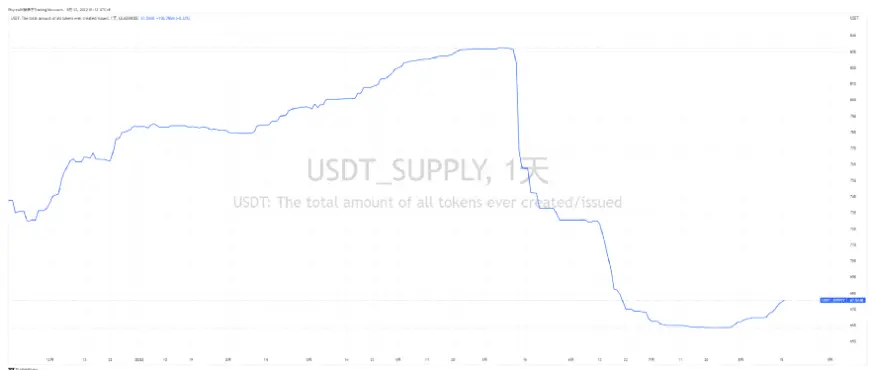
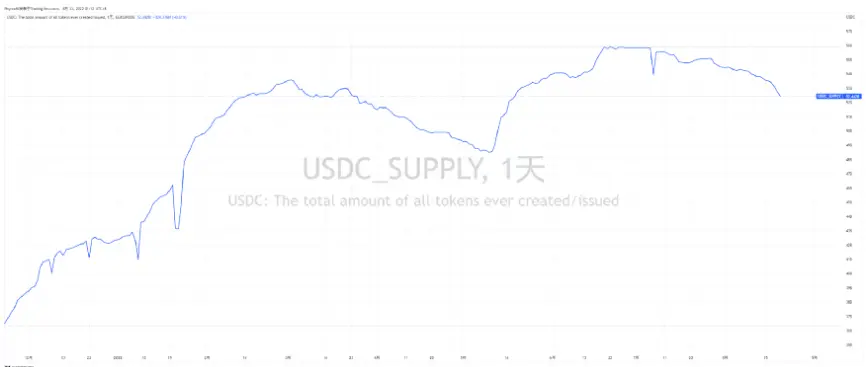
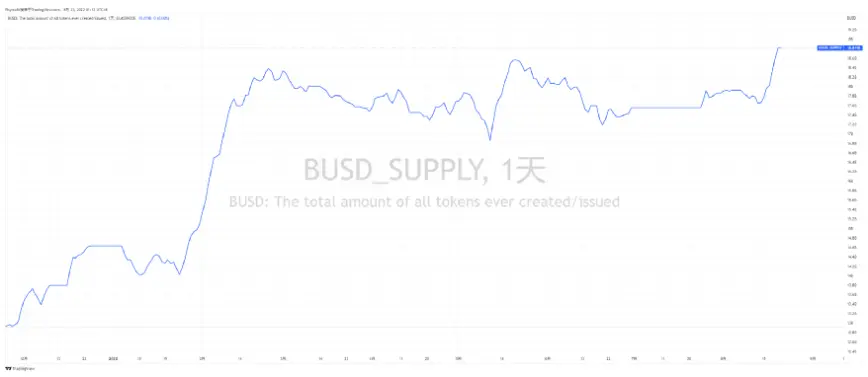
8. The current three mainstream stablecoins in the digital money market, the changes in the market value of which basically represent the upper limits of money and purchasing power in the money market, are USDT, USDC and BUSD respectively. USDT is mainly used by Europeans and Asians, and is also the main buying force in the current currency market, while USDC is mainly used by U.S. institutions and high net worth users, but it does not show the same purchasing power on the exchange, mainly used as a medium of intermediary. Although BUSD is only active in Binance, it contributes much more turnover than USDC, especially after the USDC was regulated and blocked Tornado events recently, there is a large amount of money transferred from USDC to BUSD.
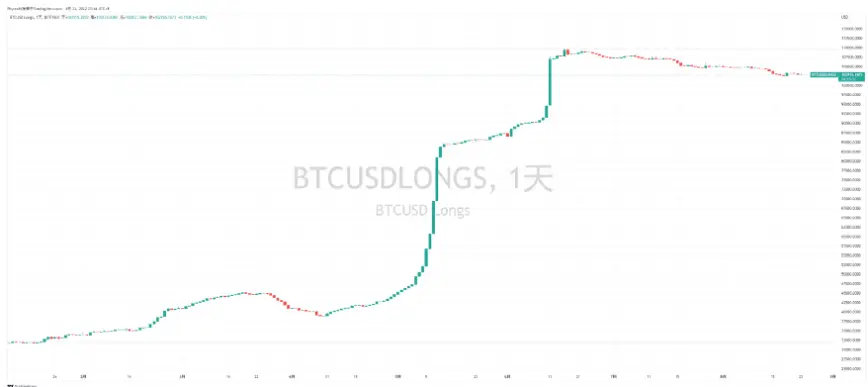
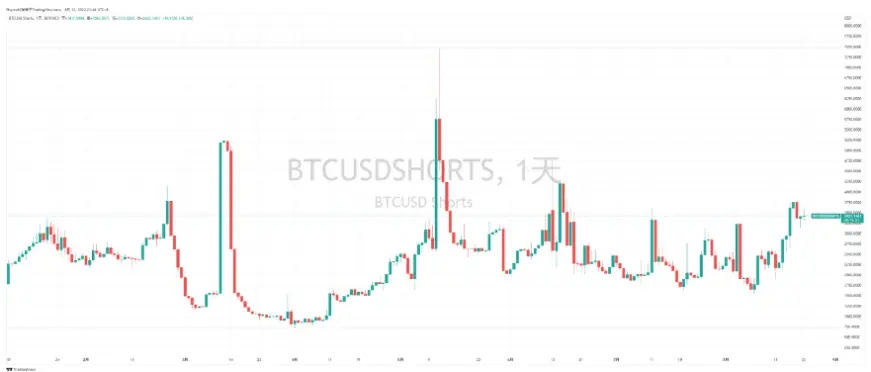
9. Although Tradingview has no way to directly look at the BTC and ETH's funds rate and leverage ratio, but can see a very important data, is Bitfinex's BTC and ETH's spot contracts, these four data can clearly see the position of large investors for BTC and ETH's judgment of the long and short, although there is the possibility of hedging, but still does not affect the auxiliary judgment of the market, what should be noted is that the average spot contract leverage ratio is very low, basically is between 1 times and 3 times, especially when a lot of chips are 1.5 times is a reasonable range. Even many investors borrow money to play the Bitfinex long-short game. Basically, the main data of Tradingview is these, of course, there are a lot of related data, but for macro and chain data judgment, it is not very helpful, so it is not put in. Of course, we'd welcome a little buddy with better data, and I'll keep it up to date. B. Website for Forecasting US CPI and PCE — — Clevelandfed.org The importance of CPI does not require me to say that even a pugilist who previously knew nothing about the US financial system should have known what it stood for after six months of pummeling, and that using CPI to predict the Fed's interest-rate hike is a game in hand.
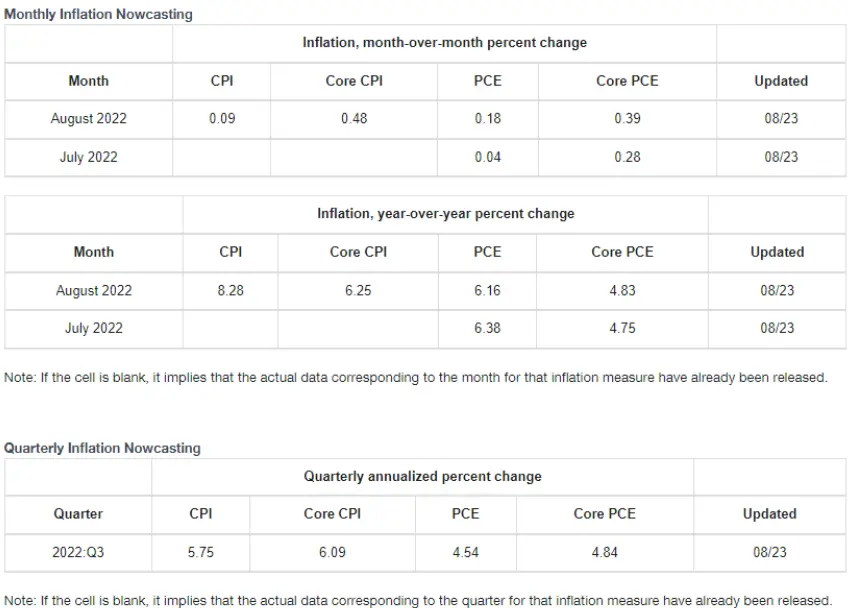
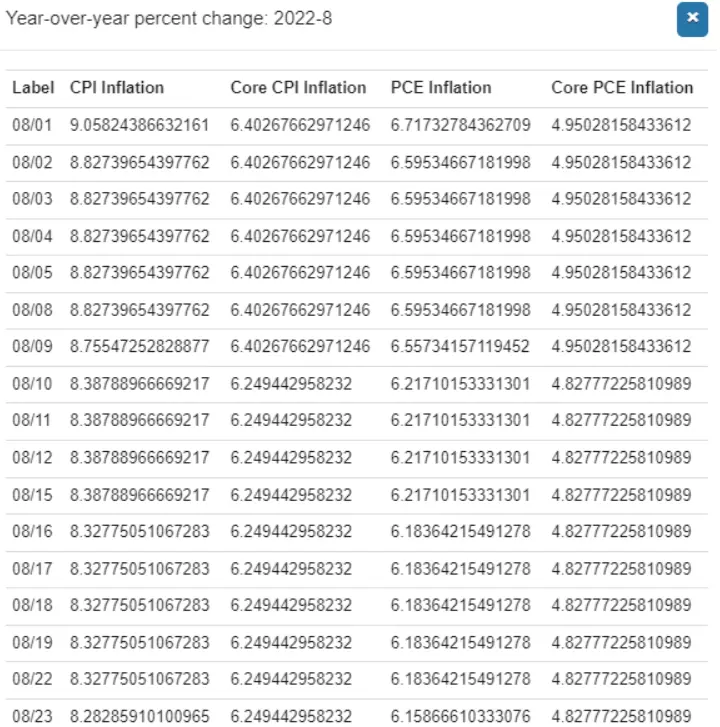
It is very helpful to know the current CPI, especially to see the change of CPI and PCE from quarter to year. C. Predicting the Next US Interest-Rate Hike — — Cmegroup.com It would take little to predict what a rate rise would do. The current change in the entire risk market is based on the current rate hike for September. When the forecast rate hike is more biased to 50 basis points, the risk market will rise in purchasing sentiment. When the forecast rate hike is at 75 basis points, the risk market will fall. It can be said that the current rate hike data is a barometer of market sentiment.
The data are always updated, especially when Fed officials make comments or when important data are released, affecting the bias toward rate increases. D. Inquire into online wBTC and ETH clearing tools— — Parsec.finance Parsec is a very useful tool for querying Ethereum online data, including NFT and many other query portals. Among them, ETH and wBTC clearing prices for several key DeFi projects have strong tracking ability, and it is also one of the necessary tools for DeFi small partners who are sensitive to the chain burst.
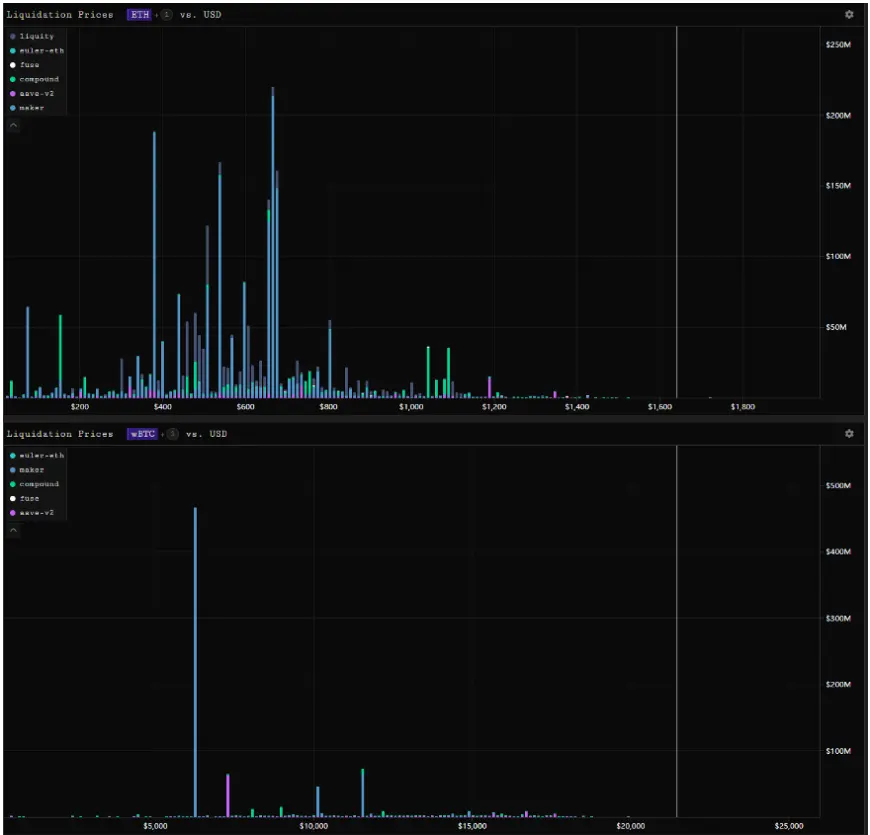
In the clearing entrance includes MakerDao, Compound and AAVE of the high TVL DeFi, in the price of the rise is almost useless, but when the price falls, the data can be clearly seen the dangerous position of clearance, can be very good expectations if a series of explosions occurred, the price can fall to what position. Secondly, my personal commonly used is the amount of funds Curve 3pool data, to see this data is not the most important to see the total amount of funds in the 3POOL, but to see whether the balance of the stablecoin broken, such as when USDT was shorted, 3POOL was the first to reflect that a large number of USDC and DAI were withdrawn, at that time USDT accounted for up to 80% of the share, so the biggest role of 3POOL is to see the stability of the stablecoin. Of course, if you have three other stablecoins, you can also open the corresponding stablecoin pool data and see real-time changes. The same type of tool that looks specifically at Curve, as well as intotheblock.com, is not particularly described. E. Inquire into current month BTC and ETH option delivery— —Deribit.com Deribit is still the dominant force in the centralized options, with 16pm Beijing time, the last Friday of a month, normally the time when the options are settled and the experience is that prices start to fluctuate more on a Monday during the week. The focus of the options has been talked to many times before, the most important thing to focus on is the biggest pain point. When the difference between the delivery week price and the biggest pain point is not too great, the seller of the options (usually the exchange and the market maker) tries to get the price close to the biggest pain point. Another data to note is the ratio of short to long for BTC and ETH, which represents the proportion of short and long investors. Under normal circumstances, the long investors will be more. F. Basic Tools for Using Data Online — — Oklink.com OKLink is my contact with the early chain data query tools, and the biggest advantage is free, but OKLink should be intended to do their own depth of data mining, not open too much outside cooperation, and the focus of the chain data is on the "wallet address" control, if compared with professional charging tools, OKLink still need to continue to work, I basically compared all indicators, found and mainstream tools compared to the miners' data deviation is still less. Especially BTC and ETH miners address balance, there is still some reference value. The address balance of the miners is a very important stock reference data, mainly used to determine the miners on the current BTC and ETH price tension, when the balance of miners gradually higher, indicating that the miners are not interested in the current price, chip in the accumulation state, the miners on the price trend has no impact. And when the miners' balance was falling, it meant that the miners had either pledged their chips or sold them, which meant that the current price had caught the miners' attention. Other data from OKLink can be used as a basic reference, but more specialized tools are needed if used for analysis. F. Advanced Use Tool for Data Online — — GlassNode.com There's no need to spell out how strong GlassNode is, basically the ceiling of the data analysis tool on the money-loop chain, even though Arthur Hayes is using it, but it's kind of the ceiling of the tool, the highest T3 fee is $10,000 a year, and it's got to be paid all at once, not even monthly. And the worst part is that 10,000 dollars buys an account that only one user can log in to, but that's not enough to stop GlassNode from being the best in the money circle, and the most common in-chain data analysis. Although the main data of GlassNode is paid to use, it doesn't mean that you can't see anything without paying. In fact, even if you register an account for free, there are still a few key data you can use for free, and they are very important data indeed. 1. Basic data. Free registration can be from the Pulses tag to see the basic data, in the basic data I feel the most useful is the 24 hours of exchange Inflow Volume and Outflow Volume data, when the inflow of chips is greater than the outflow of chips, it can be basically considered that the overpressure, more chips or active or passive stay in the exchange, will cause pressure on prices. The reverse time shows that the buying sentiment is very strong, more chips leave the exchange, for the development of the aftermarket will have a positive effect. Then there is the stock exchange (Exchange Balance) is a meaningful reference, the stock data is not representative of the price of the rise and fall, but can be seen the current mood of buying, if the stock exchange is in continuous decline, the current buying power and buying mood is good, and the stock reduction can help to reduce the maximum limit of a one-time smash. Secondly is the data of the entity address (entities) also have some reference, other similar to the activity of the address, the new address, non-zero address and so on in the bull market or the rising cycle to see OK, the bear market when the meaning is really not great. And it doesn't matter too much that the whales' numbers increase or decrease. After all, the main story of the currency market is still changing with macro sentiment. 2. Long-term holder data. This data is very useful, can say that the main value of the BTC is now in the long-term holders, and this data can be seen in the position in more than a year has not moved the BTC share of the total circulation, for example, as of 8:00 this morning 65.726% of the BTC is more than a year has not moved, which means that so many chips are in the long-term holding signs, and according to the graph can be seen, the long-term holders are increasing with the BTC price decreases, which means that more lossmaking holders have chosen to hold for the long term. And the data can effectively determine who is actually shipping.
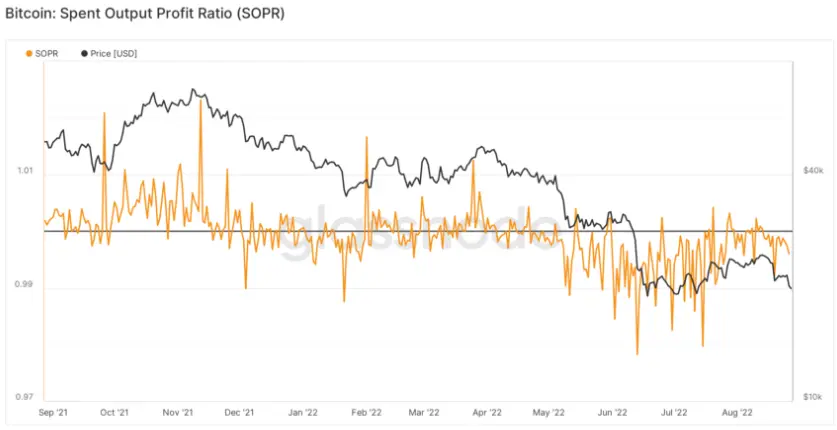
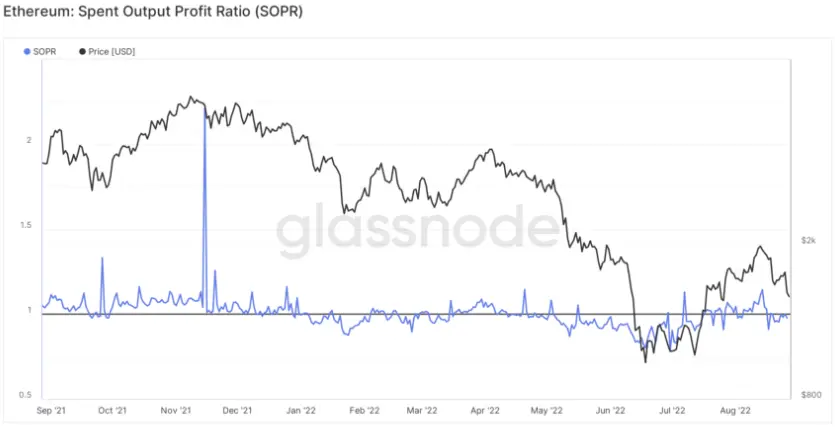
3. Expenditure-output profit margin (SOPR). To be honest, it's not a lot of data, because I currently use the URPD (UTXO Realized Price Distribution) data to judge the shipping and purchasing costs of each price, so it's a lot more accurate than the single SOPR (Send Output Profit Ratio), but even then, for a data that is free to use, SOPR is the best tool to judge the current BTC and ETH price trends. The black line in the middle of the figure represents the number "1" as the center. If the BTC or ETH of the day is more than 1, the average of the chips that transfer in the chain are all profitable. If the BTC or ETH is more than 1, the average of the chips that transfer in the chain are profitable. So SOPR's data makes it easy to tell whether the chips that are moving through the chain today are the profits or the losses. And the data is a rare data which can be seen for free by both BTC and ETH.
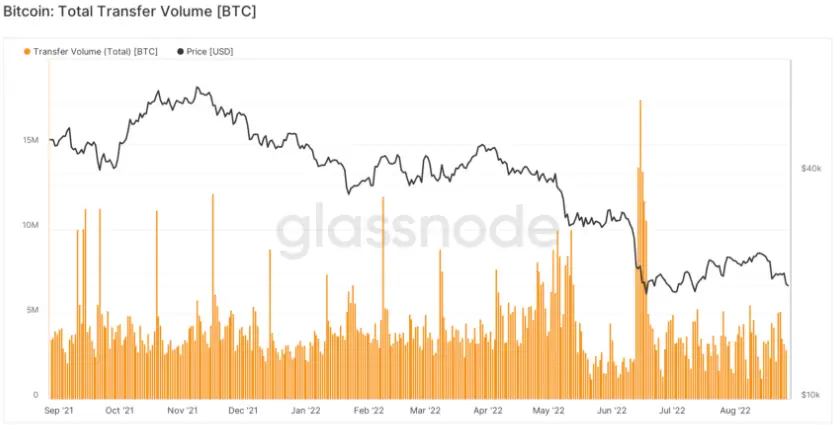
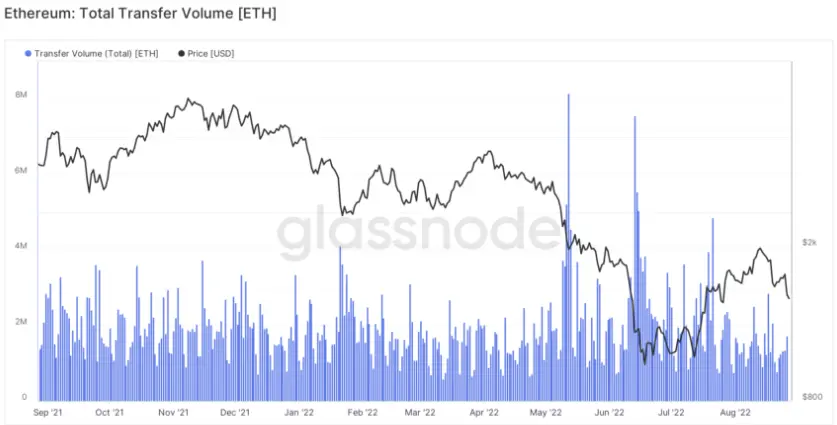
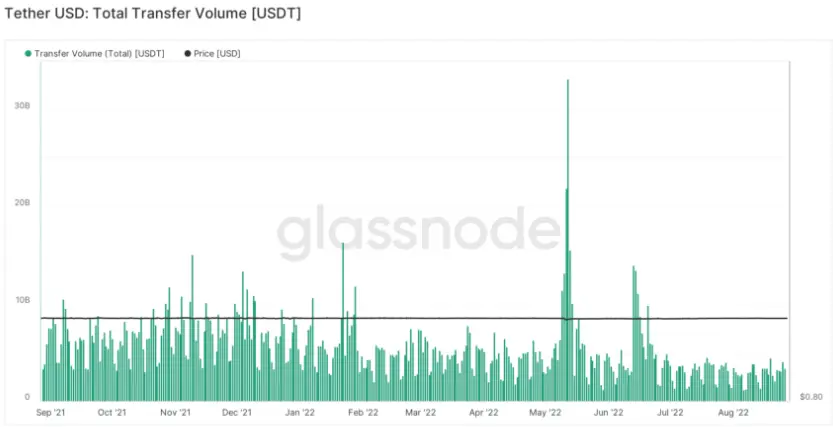
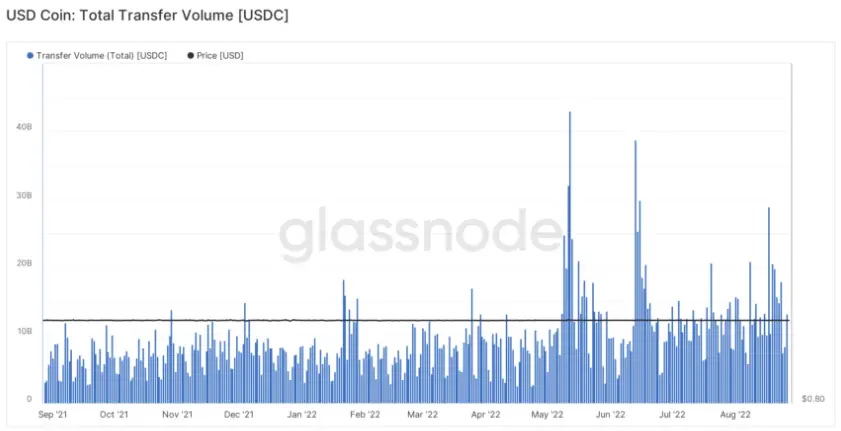
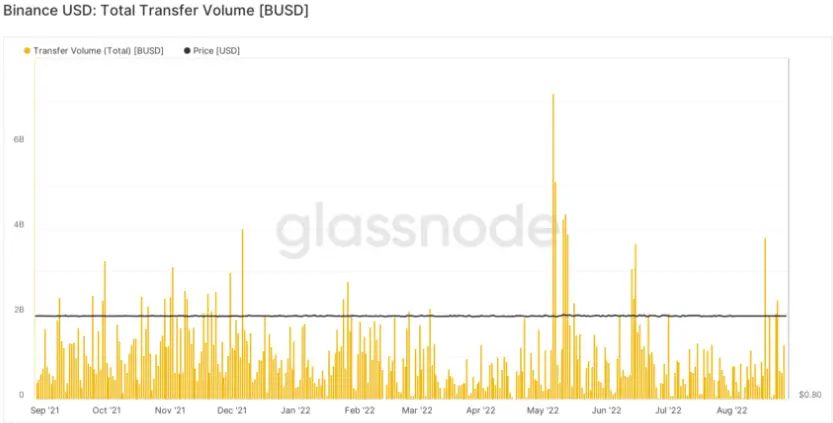
4. Total Transfer Volume on the chain. This data is actually the focus of the entire blockchain. It can detect the fluctuations in the chain including BTC, ETH, USDT, USDC and even BUSD. Although the data contains the data of the chain including the exchange, it can still be clearly shown that the current activities in the chain, especially the fluctuation of the stablecoin is what I have been most concerned about. Only when the amount of money in the chain increases, will the purchasing power transferred to the exchange be increased accordingly. So the importance of chain fluctuations is not in doubt, unfortunately the free version can not see directly transferred to the exchange data, de-duplication data under the same entity control address, but for judging whether the current will generate a blow up or buy have strong guidance.
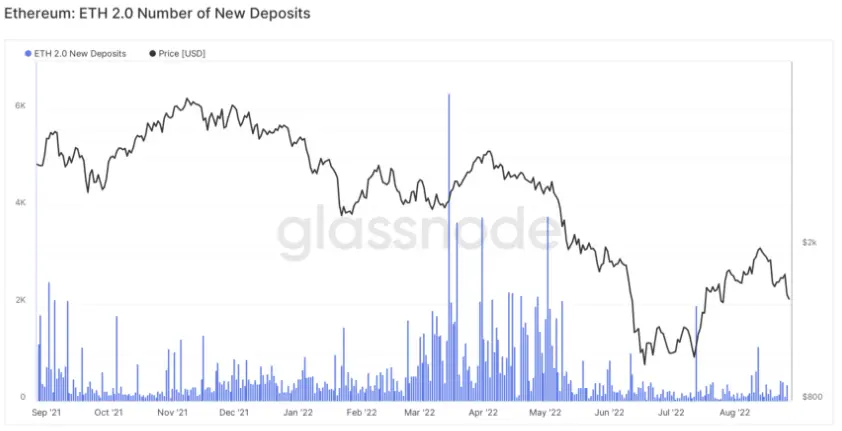
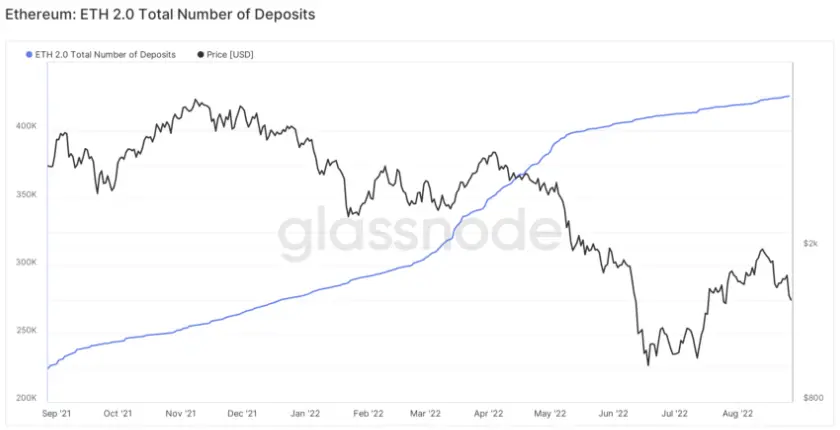
5.ETH2.0 pledge information. The merger of ETH is the only visible monetary epic event in 2022, and for ETH investors, the lock-in information of ETH2.0 is equal to the change curve of ETH price. The more chips pledge into the POS system, the more chips enter into the POS system, this need not too much explanation, each Deposits represents 32 ETHs, so as of 8:00 a.m. today, we can already have 13,386,064 ETHs pledge into the ETH2.0 system, accounting for 11.2% of the total flow. The main free data in GlassNode is not only these, but also relatively less important, or can be easily obtained through other channels, so it is not recommended, but as long as a free registration of an account can see all the content of T1 permissions. You can dig deeper yourself. G. Advanced Use Tools for Data Online— — Rdata.app In fact, the introduction should be finished at the top. However, there is an analytical tool being developed provided by a small partner. Although it is still relatively young, it has been under development for a while, and it has been done for a while. It is free for life. Facing all users, the accuracy of the data is very high. And more data will be added. There's not a second identical tool in the entire circle, and the point is free. (or even open source in phases)
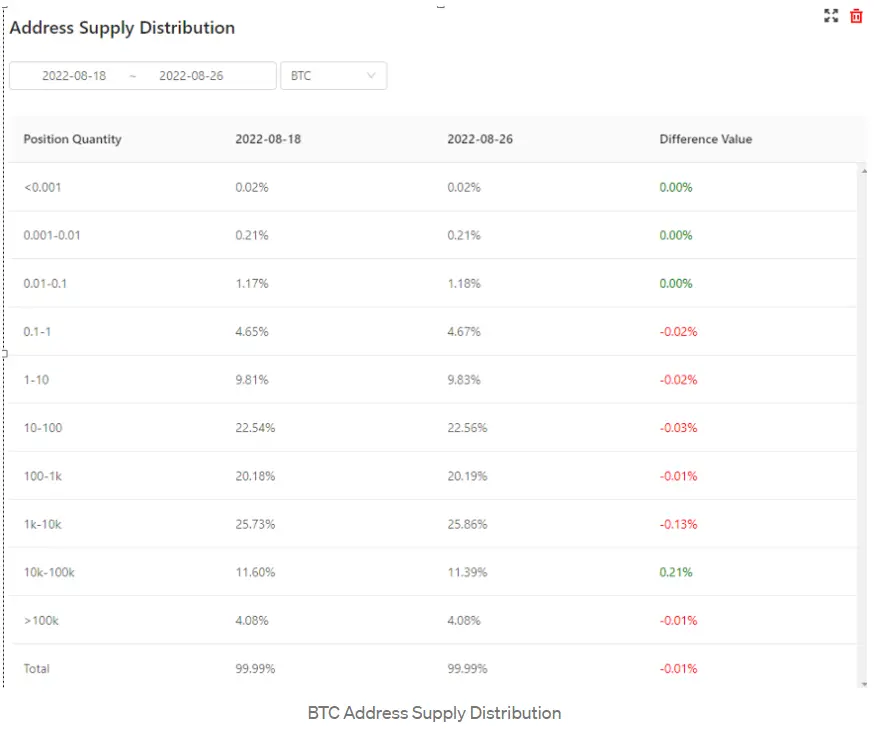
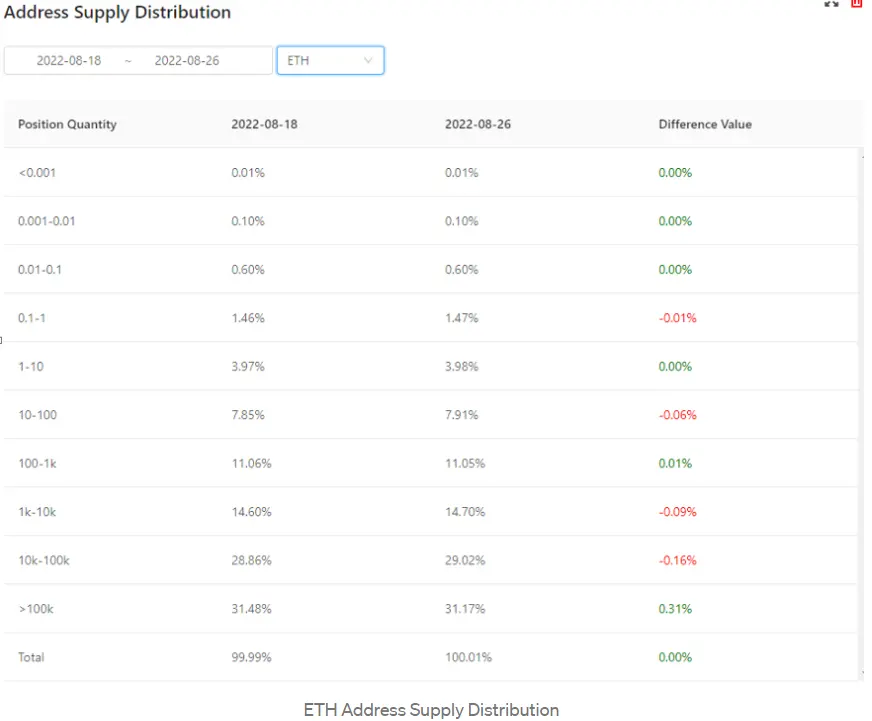
1. Position address distribution. The key data in the focus can directly see the BTC and ETH chips flow in the selected time period, can clearly distinguish the proportion of the holding chips in each level, can be clearly learned by comparison of more chips to which direction to move, for example, from today's BTC data can be seen in the last week in the last week more chips flow to hold 10,000 to 100,000 whales. The ETH is also in the hands of whales holding more than 100,000 ETHs, so we can see that as of today, the whales are hoarding BTCs and ETHs in large quantities.
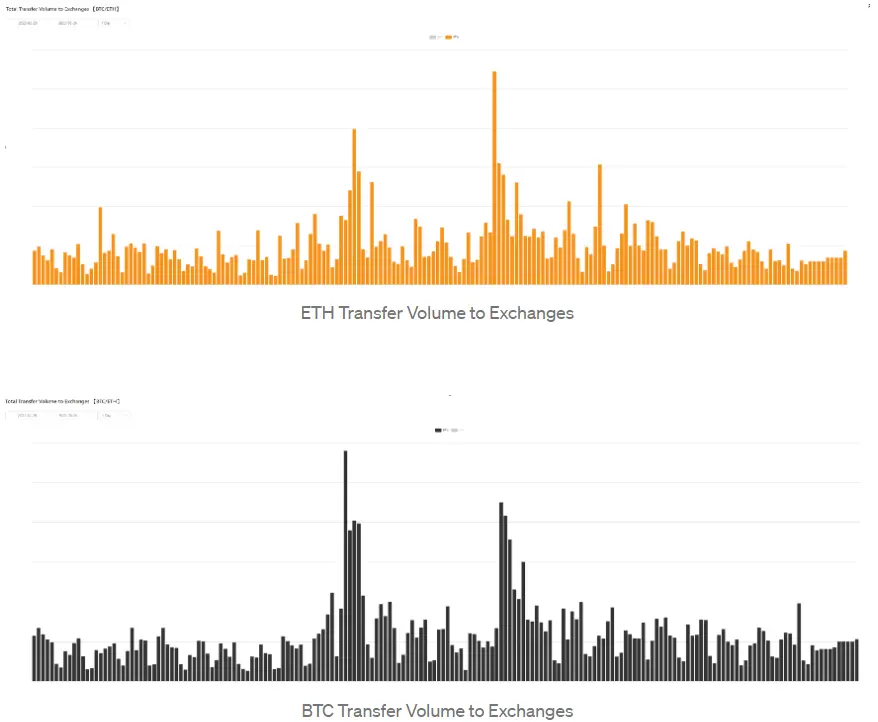
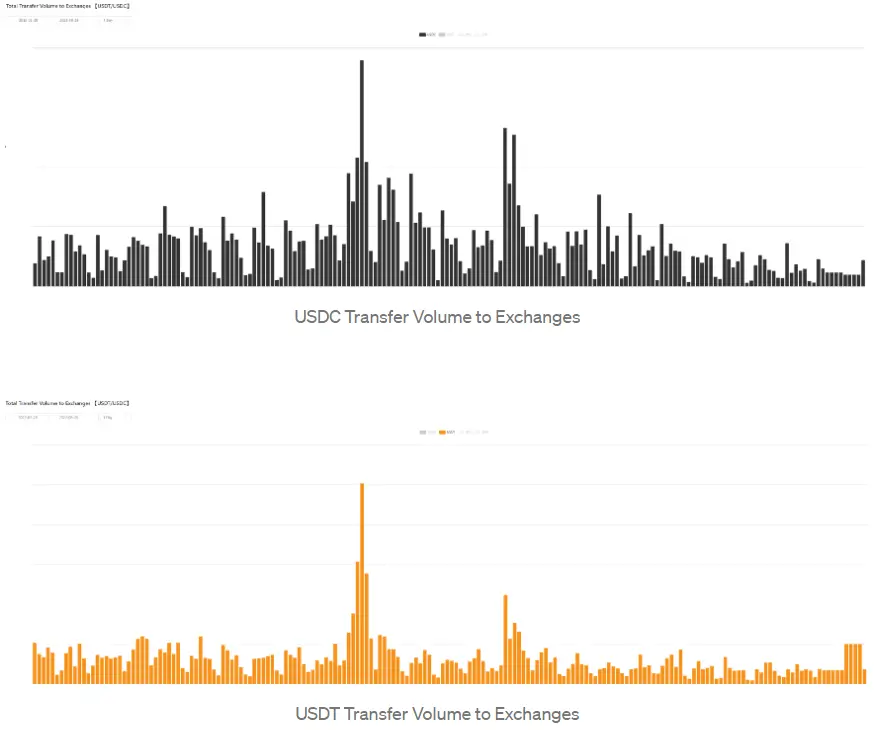
2.BTC, ETH, USDT and USDC transferred to the exchanges. This is the data I watch every day, so I don't have to say much, I understand. 3. Time-differentiated URPD data is customized data developed by my partner based on my daily BTC position price distribution. And that's not a lot of explanation. That's about 70% of the problem that's on the chain. At present, the tool is still in the process of continuous updating, and will add more contents in succession. It is a simple version of the data analysis tool on the chain. Although there are still many shortcomings, there are also many bugs, but it is not difficult to make a little research on the data, especially look at the small friends I analyze often, I should be able to see the importance of this tool. H. Macro Information Acquisition Tool — — Jinshi Finance Golden Tenth should be the most easy-to-use website at the moment for obtaining international financial and economic information. It has no messy content, is basically all information, and can be filtered to basically meet the needs of most Fed data acquisition, including live text messages of Fed officials.
PS -: If anyone wants to donate for this free useful data then please send it to link given here ::::: PayPal.Me/CryptEducator007 .





