Before we begin today, I want to share with you that the reason why I'm at the forefront of this is because this boat has not actually been turned over in history, so it's kind of a high quality boat. This content is also what I said yesterday while watching Talk Jun's video. After I said that, I went to do some research. It is very important for many small partners of the money circle, especially for those small partners who have not deep understanding of the macroscopic view. This is what happened to US prices in the mid-term election. For the currency kids, we've been looking at a half-cycle of BTC, but for the bigger US stocks, there's a cyclical effect, and it's very obvious. Economists have compiled a list of what the S&P 500 has been like every four midterm elections since 1962 until 2018. Of course, the circle looks more like the Finger, but it doesn't get in the way.
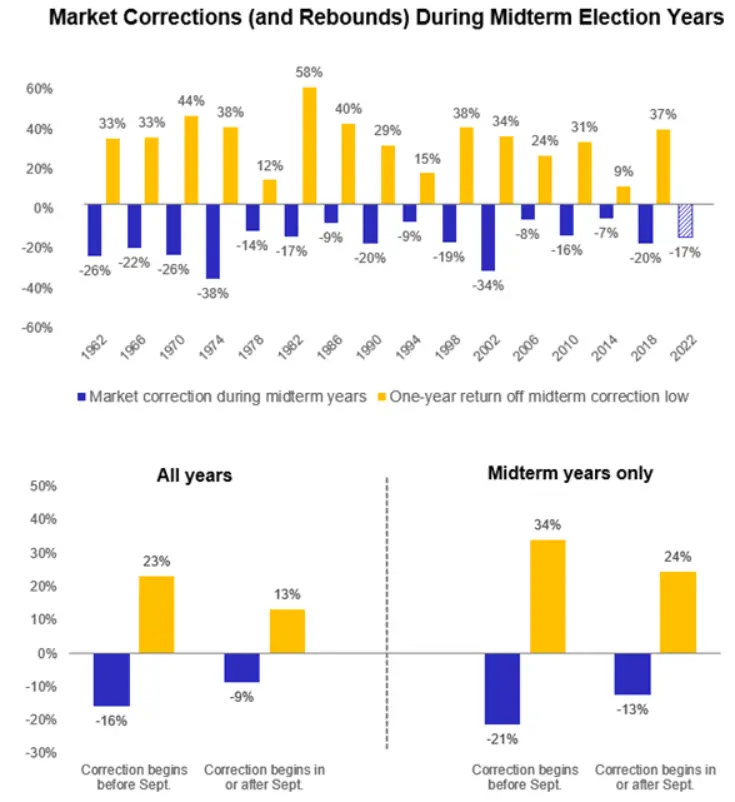
It's actually pretty clear from the chart above that 12 months before every election cycle, the US is a very knotty bunch and when the three months after the mid-term start, six months and counting are extended to 12 months, the S&P 500 is a distinctly better performer than before the mid-term, a pattern that has been uninterrupted for 56 years. And it is indeed used many times, and summed up a more complete theory, not detailed. In summary, the US stocks rose by 20% more during the mid-term elections than during non-mid-term elections. And when it was really the US presidential elections, the stock market performed only 5% more than at the same time. So, judging from the historical data, it was only after the mid-term elections that the US stocks erupted. There was even a summary that "the sooner the stock market fell in the mid-term election year, the stronger the recovery". The worse the plunge before the midterm elections, the better the rally after the midterm elections. Interested friends can go to Google "Midterm election years stock market" to get more knowledge, thanks to Lord Talk's tips, for me on the wild side of the road to completely expect this boat. But this is just a boat of moments, and does not mean history will return. So there is still a case for basing bets on current conditions rather than blindly betting, especially when it comes to using high leverage. However, there are still two months before the general election, and in the next twelve months it is almost always 2024. In 2024, not only will the Fed choose to cut interest rates, but also in 2024, there has been a "boat" in the BTC's reduction cycle. That is, the first half or the second half of the year has been good. So, expect, but don't gamble on that basis. Of course, with the mid-term election, there will be the Fed's last two interest-rate hikes in 2022. If one takes a medium- to long-term view, while the current game is still 50 basis points or 75 basis points in September, any increase in September will be the last high of the current round as long as inflation recedes, implying that the worst is over, even if the Fed were to keep its terminal rate at 4% through 2024. So, if inflation is under control, even if it is not a bottom now, then September and October (with no rate-hike meeting) will surely be a partial bottom, while the Democrats' mid-term elections are bound to attempt to stabilize financial conditions. And, given that the macro picture is bound to be the beginning of the end of high interest-rate hikes, a gradual market recovery in the fourth quarter is not out of the question, but only if inflation is indeed brought under control and continues to decline. But as things stand, the picture is not rosy. The decline in US domestic oil prices, which had previously been caused by expectations of a recession in the US economy and an increase in OPEC oil production, briefly dropped to less than $90 in mid-August. The CPI reduction in July was mainly due to oil prices. Although used car prices were relaxed, services and housing remained high in August, and oil prices must also be the main force reducing inflation.
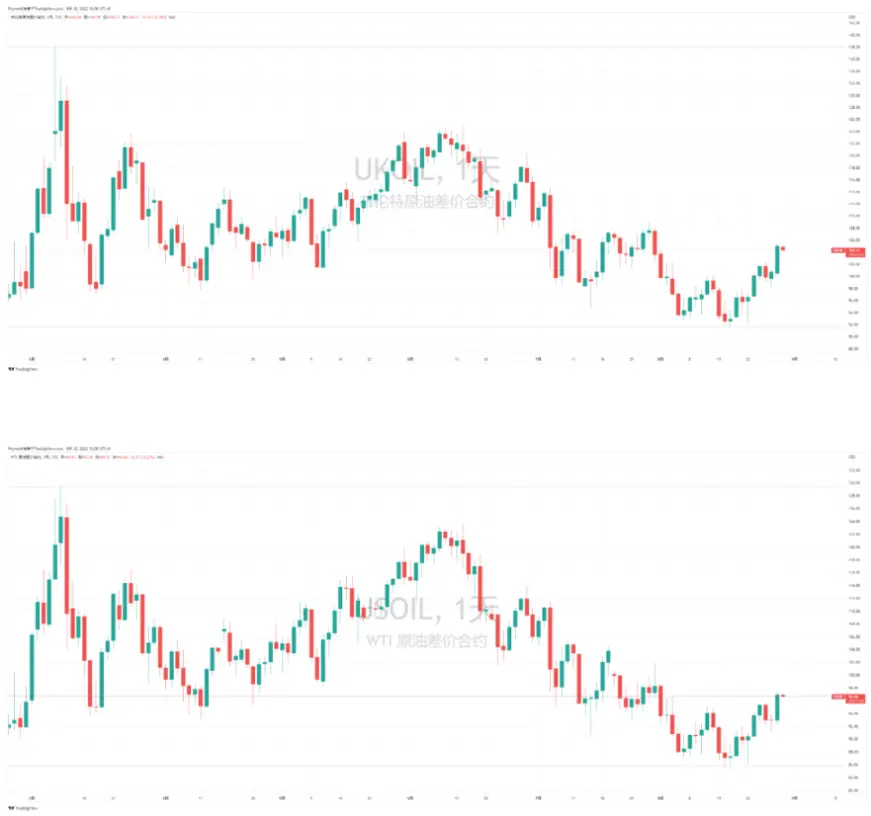
That began to reverse by mid-August, partly because the Fed and White House had heralded the strength of the non-farm numbers as a boon to the economy, leading to weaker market expectations of a recession. On the other hand, it is because the increase in Syrian oil production has led to expectations from OPEC that it might cut production. As a direct result, Brent returned directly to its July average, while WTI erased the entire August decline.
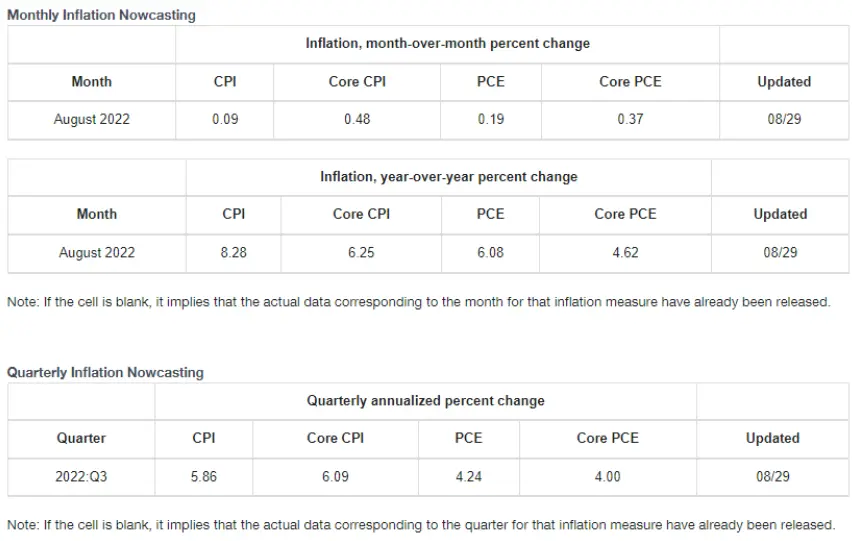
In view of the situation, although the August CPI data still has a chance to see a downward trend, if the oil price cannot be controlled, the CPI in September will likely rebound. If this happens, then November will be the trouble. However, the White House issued an expectation on non-farm cooling early this morning. It is estimated that the non-farm data released on September 2 will directly halve, and it is not known whether it will have a positive effect on limiting oil prices.
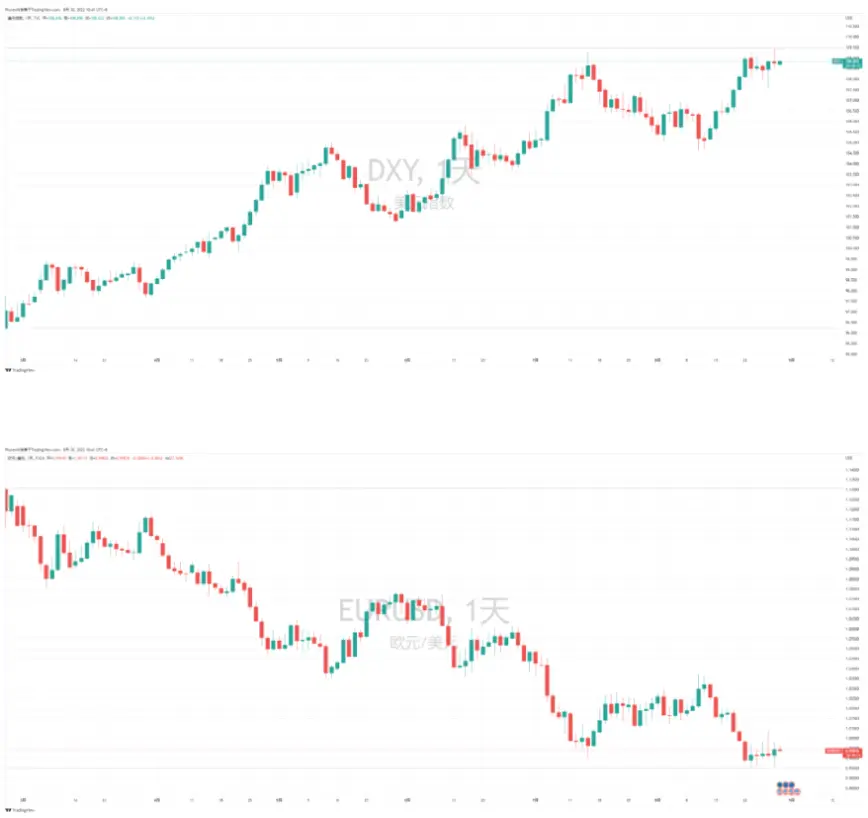
On the other hand, with the expectation of raising interest rates in the euro area, the exchange rates of euro and dollar are beginning to recover, especially in the United States. While the rate rise in the euro area has just begun, it is believed that even though it is not at the top of the dollar index now, it will reach a stage-like top before November (November again), which should be helpful for funds in risk markets.
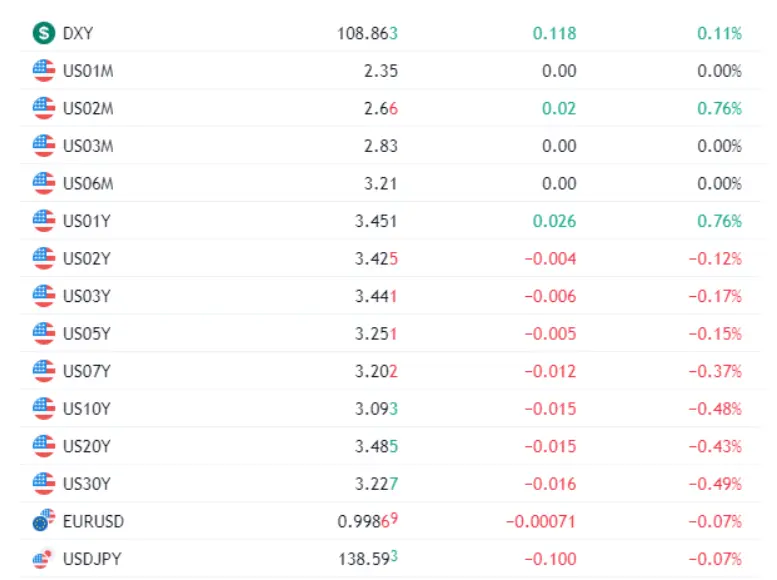
So far as U.S. debt is concerned, short-term U.S. debt's reproductive rate continues to rise, especially as the March and June Treasury bonds issued on Monday show higher yields than the last time, but March Treasury bonds are more popular because of economic concerns. As for the medium and long-term U.S. debt, although there are signs of capital entering the market, the extent is still small, the change in the colonial interest rate is not great, and more capital is still waiting and seeing. As September approached, many of the smaller partners began to worry about the direct impact that a September contraction of $95 billion would have on the risk markets, or the currency markets. As things stand, September's contraction of $95 billion is the largest ceiling, but it does not necessarily imply a contraction of $95 billion. The second most important component of the contraction was $60 billion in Treasury notes due with no sequestration, and $35 billion in MBS, whereas the amount of Treasury notes due in September was $43.6 billion. So the Federal Reserve's largest sale in September was $16.4 billion, compared to $13.6 billion in October. Because it is not a one-off sale, it will not be a big shock to the Treasury market. And Treasury bonds are not doing very well, with large capital outflows, so the actual number of Fed executions is not yet known. There is no need to worry too much about shrinking tables just yet. After all, the Fed's overall plan to shrink its balance sheet amounts to only one or two quarter-point rate hikes.
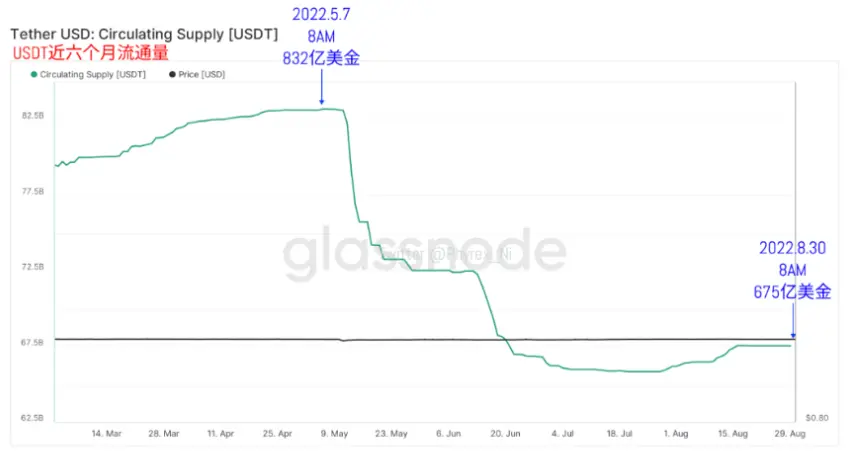
Compared with macro-sentiment data, the stablecoin's market value has received more attention, especially in the current unfavorable market environment. Judging by USDT's market capitalization, there has been no further movement, and it has been time to stay horizontal, which means that while investors in Europe and Asia are staying on the sidelines, there is no sign of capital leaving, owing to the fact that unstable assets were already leaving the market when they were shorted.
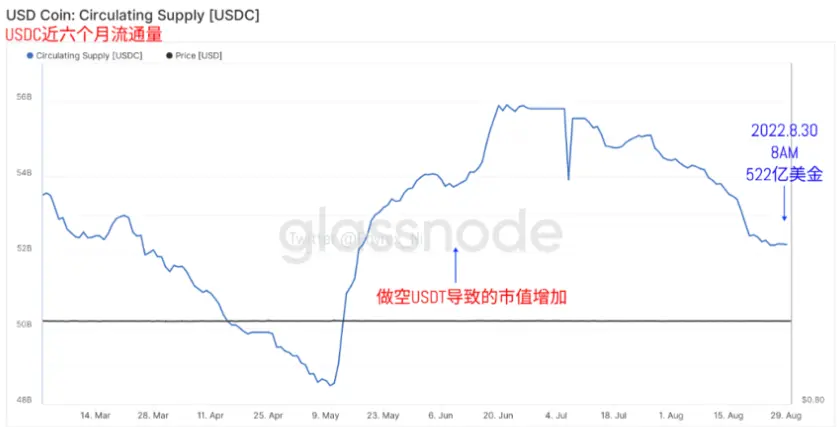
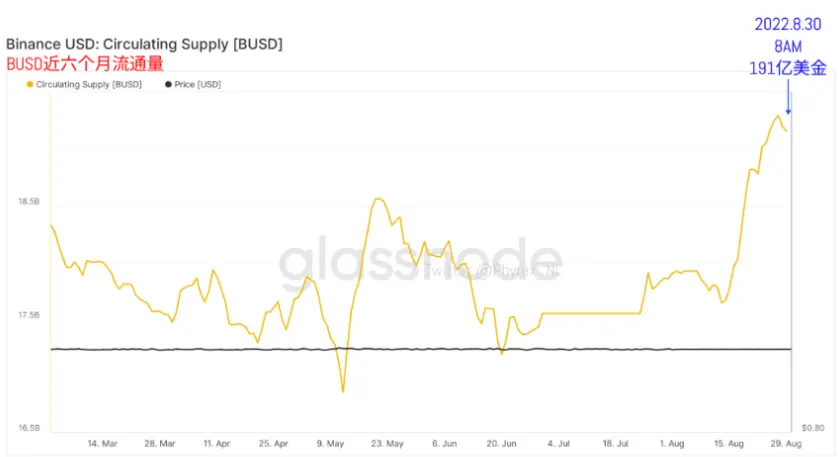
And while USDC's large market cap divestment has ended, there are still small signs of a departure. By 8:00 this morning, USDC's market cap had again dropped by around $10 million, and BUSD had the same thing happen. The impact of the embrace of regulation did lead to some USDC users switching their money to BUSD, but it seems to have peaked. In the same time, BUSD's market cap dropped by around $40 million.
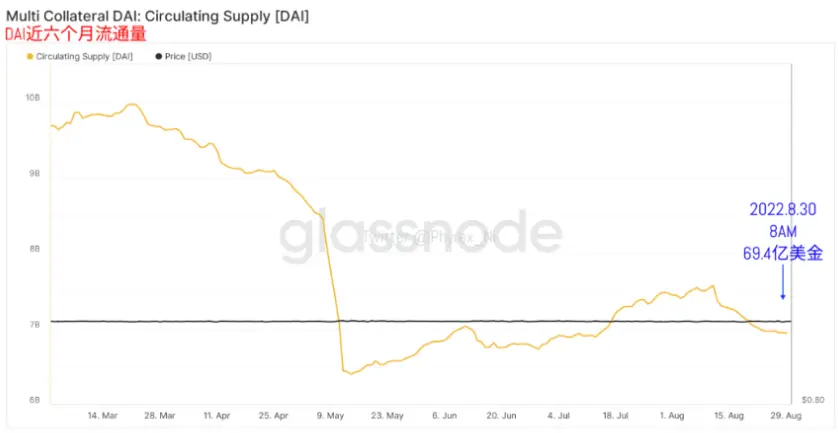
In addition, as a measure of the ETH spot leverage, the market value of DAI has maintained a stable trend recently, although there was about 1 million US dollars of selling, but this is not much, this shows that the ETH market is relatively stable at present, although many investors do not consider it a price bottom, but there is no sign of a large selling, indicating that the current price is still considered a low stage.
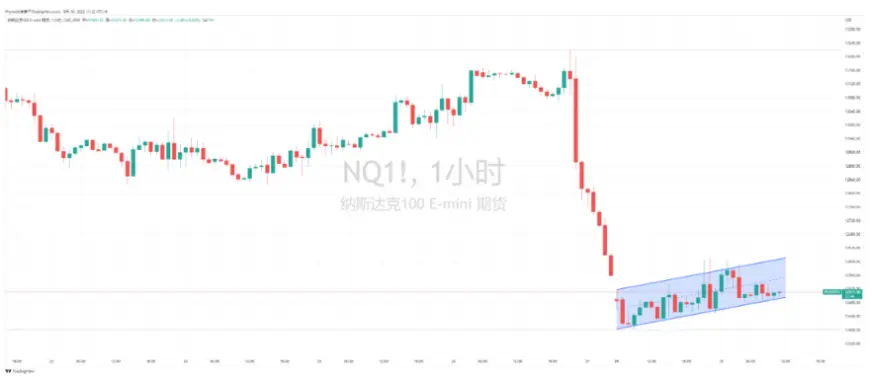
In terms of the overall stablecoins, this week's start of a series of market sell-offs in the value of the stablecoins is bound to have a lot to do with Powell's speech on Friday. But the currency market is still closely tied to the Nasdaq. Although there is no good news, if the Nasdaq can "hit the bottom and bounce back," then the currency market is certainly not going to be too bad, and judging by the movements of Nasdaq futures after the close of morning, there are certainly no opportunities.
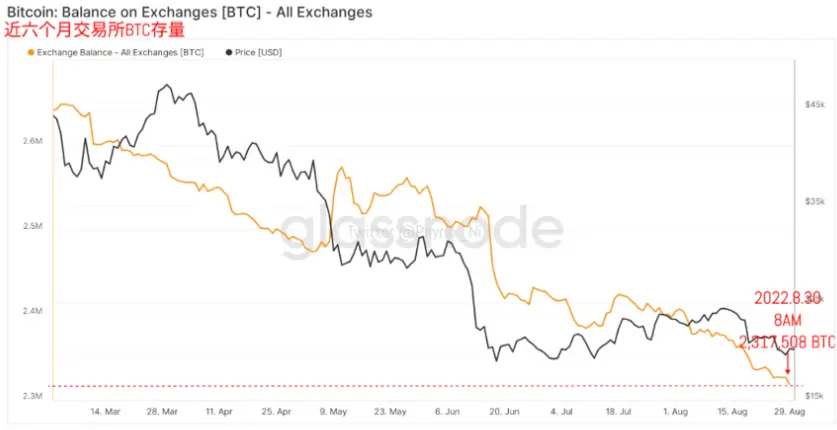
From the BTC stock exchange can be found, as of 8:00 this morning, the BTC stock showed that the selling pressure was lower than the transfer withdrawal data in the last 24 hours, this led to the BTC stock refreshed nearly four years of the lowest inventory, and represented that although the market is not very good, but the buying mood is still high, there are still a lot of chips to leave from the exchange, more money holders are optimistic about the future trend.
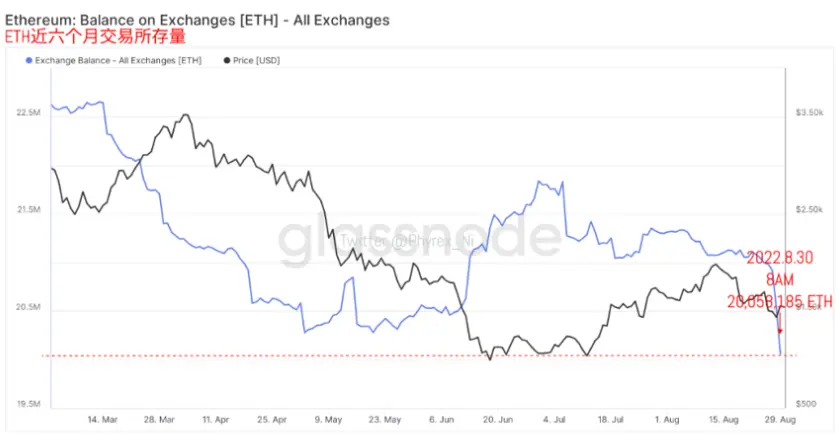
On the other hand, from the exchange data of ETH, before the ETH stock has been at a high position, which is the reason for the surge in selling pressure of ETH, but up to 8:00 a.m. this morning, data can be seen that two consecutive days of ETH showed a large number of signs of selling, today as BTC, the lowest inventory in nearly four years, but because it is a large single transfer can not be completely sure whether this is a user behavior or an exchange behavior. And from the BTC and ETH sentiment, although the price has a slight upturn, but whether BTC or ETH in the emotional aspect or the main bearish, a slightly different is that BTC although the main bearish, but the mood has begun to shift gradually, but ETH is still in a large amount of bearish state. In the current currency market environment, it is still necessary to look at the trend of the Na Chi options; after all, the correlation degree is still high. Therefore, looking at the overall situation, the Nasdaq futures continue to maintain its upward trend. Although there is no more positive news, the relative market has accepted the fact that an interest rate increase of 75 basis points is likely in September. And Friday's decline is the market's advance judgment. Therefore, before the non-agricultural data appears, the risk market will continue to be dominated by fluctuations. The decline in the non-agricultural data is not necessarily a bearish market, but will reduce inflation by weakening the expectations of the US economy .
PS -: If anyone wants to donate for this free useful data then please send it to link given here ::::: PayPal.Me/CryptEducator007 .





