
Hello friends
once again here with information and news about the price of bitcoin.
let's do a little analysis.
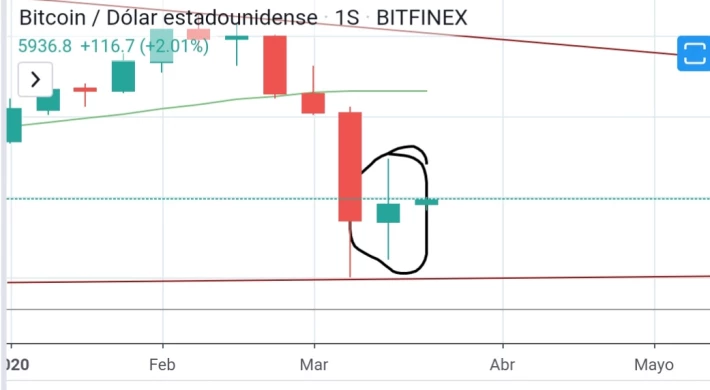
we start with the weekly chart.
This week has been a week of indecision, with a candle that has a lot of wick above, a lot of wick below and a body that was basically centered.
if we go to the daily chart
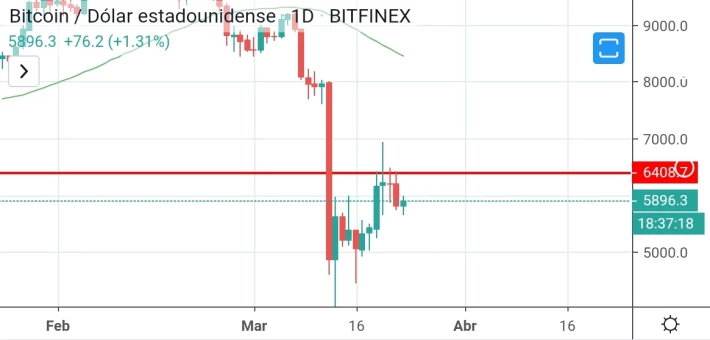
today the price of bitcoin has been going down, ok $ 5926 currently held.
What can we think about seeing the chart?
we already had a support at $ 6000, see how it broke and went a little lower.
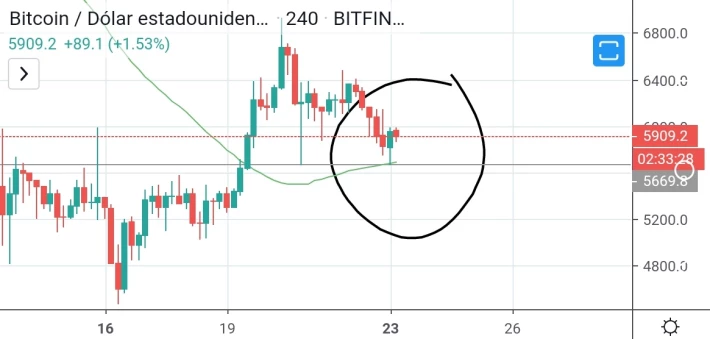
If we go to the 4-hour chart we can see that it had a small recovery reaching $ 6800 then it had a fall towards $5800 touching the moving average 50.
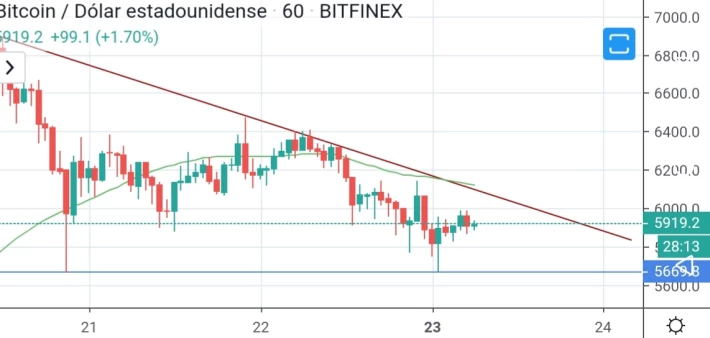
In the hourly chart it is much worse, keep touching this edge that has been
a bearish channel.
Now the question is:
Will we see a breakout at the $ 5,000 level and then 4,600, $ 3,800?
Or we will raise these resistances $ 7,000, $ 7,500, $ 8,000.






