Foundations for predictions and strategies
In this post I plan to share my trading diary and BTCUSD price predictions for the next 24 hours. The post will be updated throughout the day as my trading evolves and the market changes. The predictions are based on machine learning algorithm that I have developed in python.
Please see my post dated 27.03.2021 for more details on the foundations and strategies.
Monthly trends and seasonality - $60k breakthrough in April
Previously I was writing if $60k is local top as March typically is a month of consolidation or bearishness. April and May have typically been months with average returns above 10%. The interquartal range of return the last ten years for Bitcoin has been between three percentage to 27 percentage. This implies a reasonable target for April at least close to $70K.
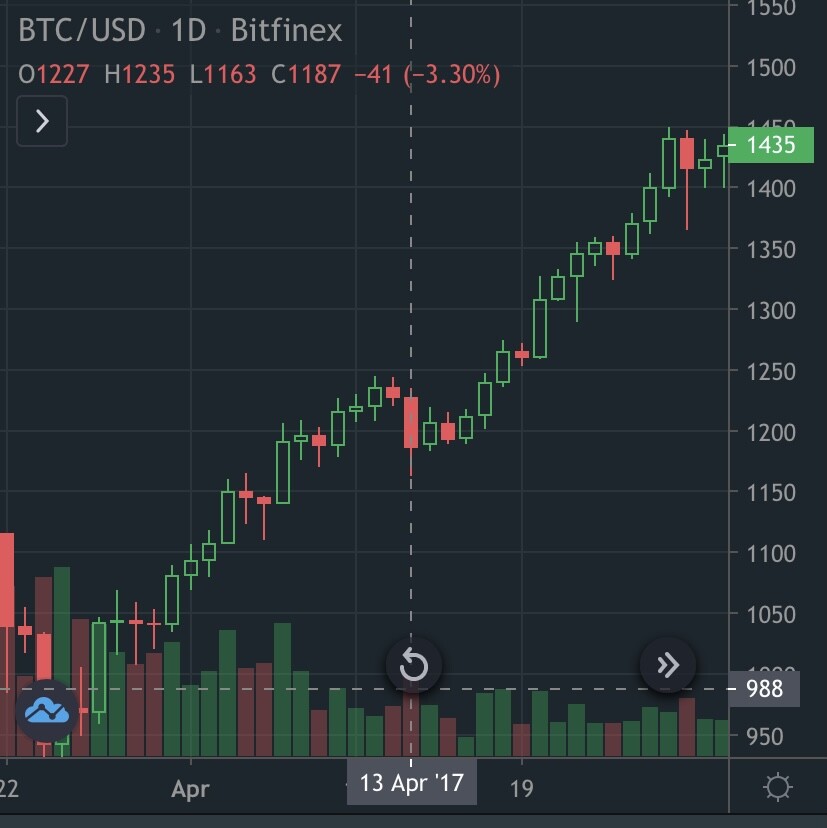
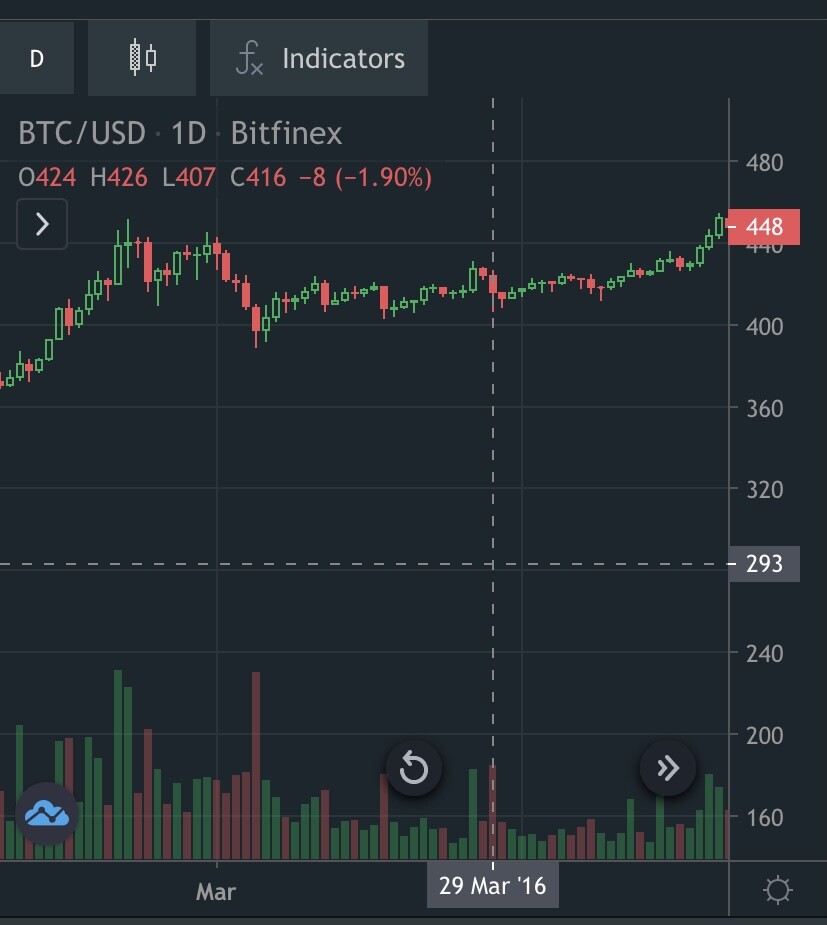
Historical Eastern holiday prices development
It might be a good opportunity to buy end of Eastern holiday.
YTD trend and end year forecast - four more years of buying the dip
There seems to be some predictability of four year boom and bust cycles, if so the current boom cycle has just begun, and we can expect four more years of bitcoin trending upwards, however not without corrections along the way.
Bitcoin price last week, trading diary and predictions
We might the price go a bit lower before a rebound.
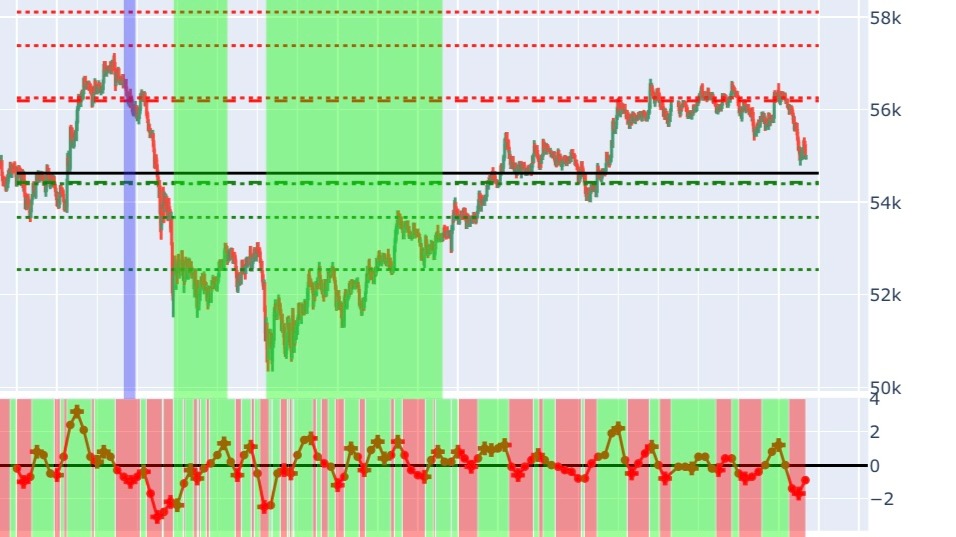
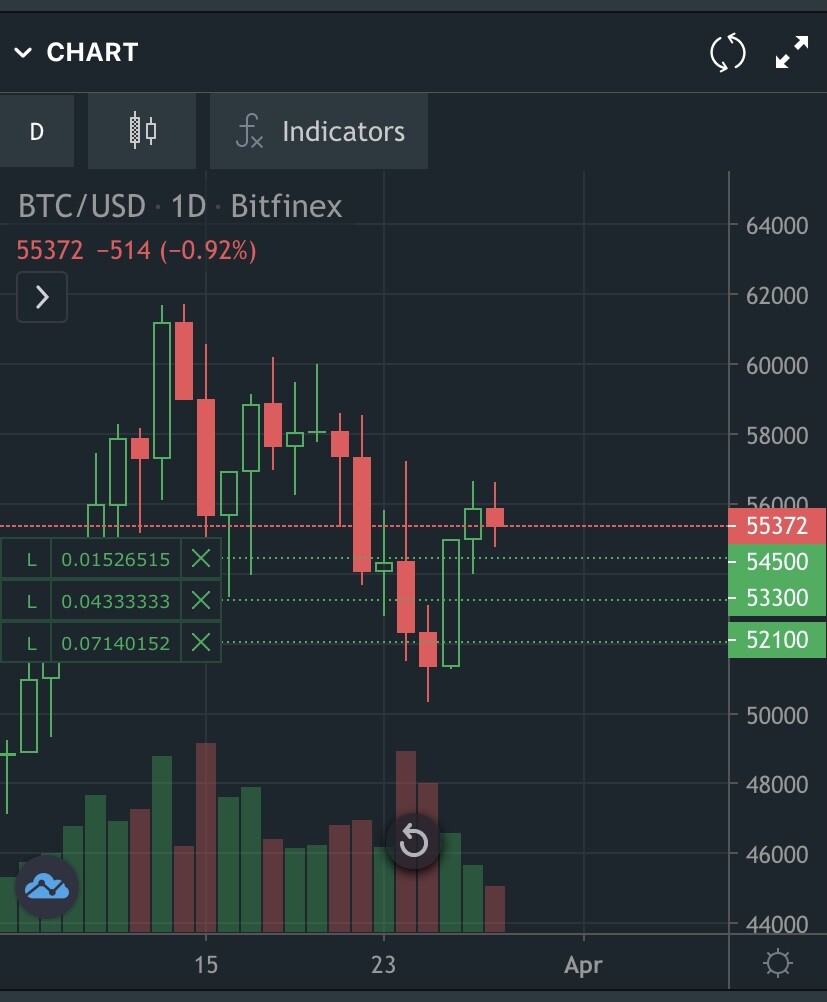
The chart consist of three sub plots along the same time series. The upper subplot contains historical ohlc price, together with the pivot points for support and resistance. The pivot point are for 6h, 1 day, 2 days and 3 days. The black line is the predicted price the next two hours. The rectangle shows the start and end of closed positions. There are four different potential outcomes of a closed position.
- Long gain - Green rectangle
- Short gain - Blue rectangle
- Long loss - Red rectangle
- Short loss - Pink rectangle
The middle subplot shows the predicted percentage change the next two hours. The lower sub plot shows the position between support 1 day and resistance 1 day. The colored rectangle on the two lower sub plots shows the trend according to the directional change described above, using a threshold of 0.7%.
Entry strategies and closing strategies
Since April have historical given returns of above 10 percentage on average, I'm tempted to buy beginning of April with a target objective of $68-$70k, this might actually prove to be a conservative target given some of the historical returns in the month of April.
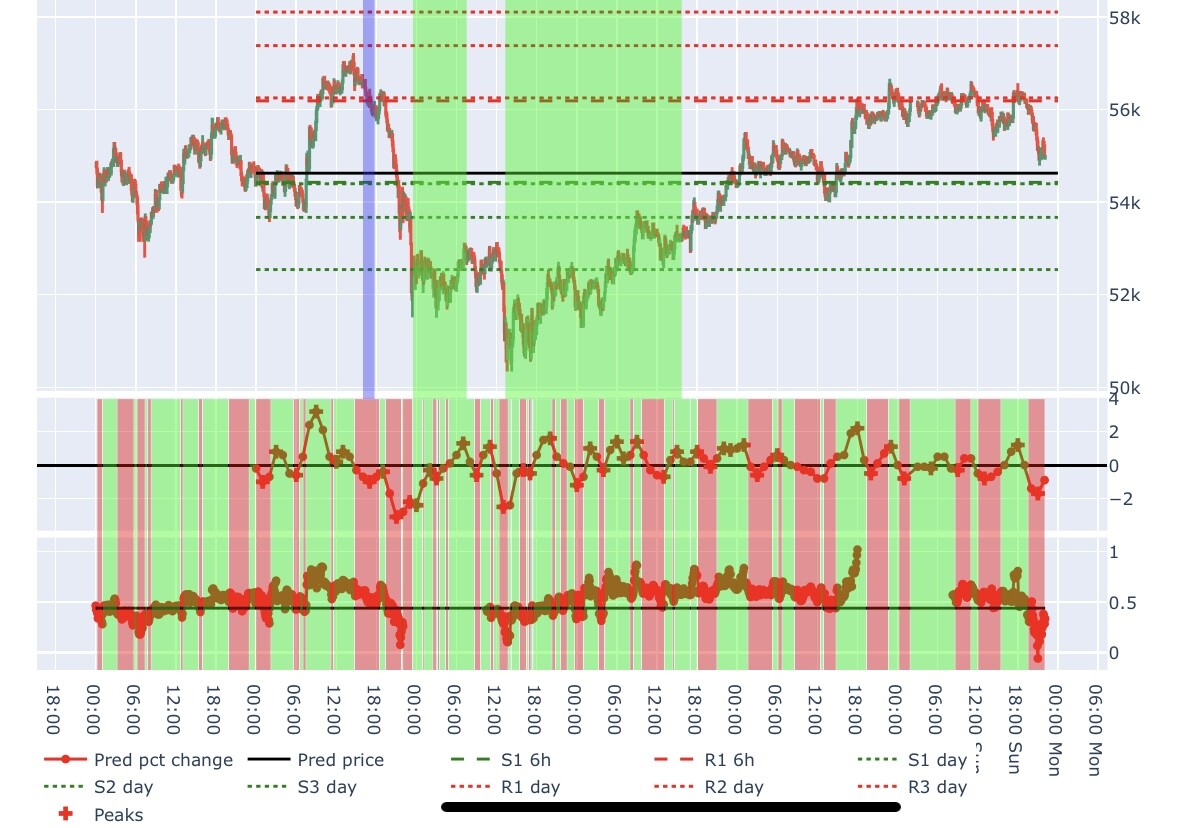
Prediction for a 0.9% change the 24 hours
There is a 97% probability that we will see $55,793 within the next 24 hours according to my machine learning algorithm.
This week closed position(s) and lessons learnt
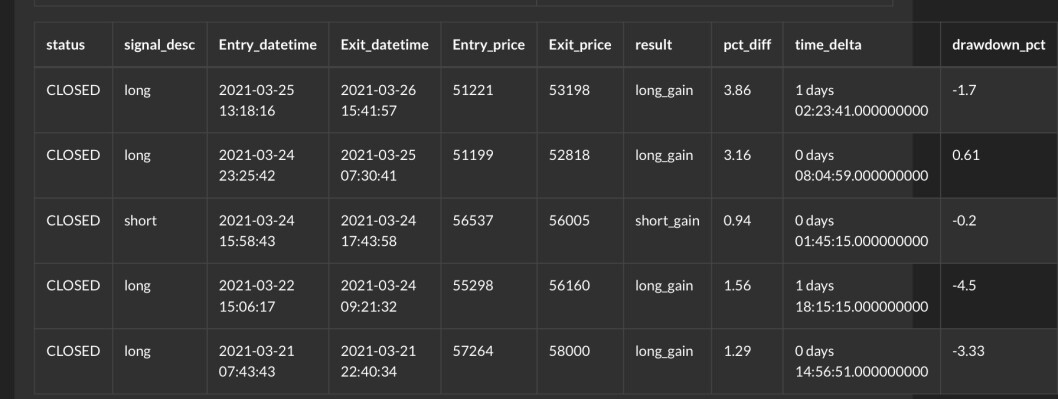
In the table above you can see the first long position closed with profit, I entered to early and faced a draw down percentage of 3.33%, only to gain 1.29%. However I was able to exit in a local top.It was on Sunday.
On Monday was the second long position closed with profit, but I also entered to early, however the first entry was with a relative small position which I kept adding to with the purpose of lowering my base price. At the end I was able to exit, however the exit was too early.
Wednesday a short position closed with profit. It was a good entry at the top, however I should have kept the short position with a trailing stop as I could have gained much more. I feel very nervous when opening short position in this market, and I don't recommend to do it.
Thursday morning I closed my long position from the day before with a nice gain. Low risk trade.
On Thursday was my last trade, and I clearly exited too early .
Every investment and trading moves involves risk. You should conduct your own research when making a decision.