Foundations for predictions and strategies
In this post I plan to share my trading diary and BTCUSD price predictions for the next 24 hours. The predictions are based on machine learning algorithm that I have developed in python. The machine learning algorithm predicts every 3 hours the probability that the price will change 0.9% in the next 24 hours. Another algorithm predicts every hour the % change the next 2 hours.
The potential stop loss and take profit levels are based on pivot points for 6h, 1d, 2 day and 3 days. The latest short term trend is identified using a method I found in the book "Detecting regime change in computational Finance Data Science, Machine Learning and Algorithm Trading by Jun Chen and Edward P K Tsang. The directional change threshold I have applied is 0.7%. A directional change event will be confirmed when the price changes reaches the threshold. Often when when a directional change happens the price tends to continue in the same directional, more so if the directional change happens at a key pivot point.
The trading strategies are based on margin trading with a trading wallet of approximately 1000 USD where a 10x leverage can be applied.
Medium term trend - 60k a local top?
March typically is month of consolidation or bearishness. March is coming to an end, high probability of seeing the next leg up before the summer.
YTD trend and end year forecast - four more years of buying the dip
There seems to be some predictability of four year boom and bust cycles, if so, the current boom cycle has just begun, and we can expect four more years of bitcoin trending upwards, however not without its corrections along the way. Highly likely that the before December this year would will see price point higher then today.
Bitcoin price last week, trading diary and predictions
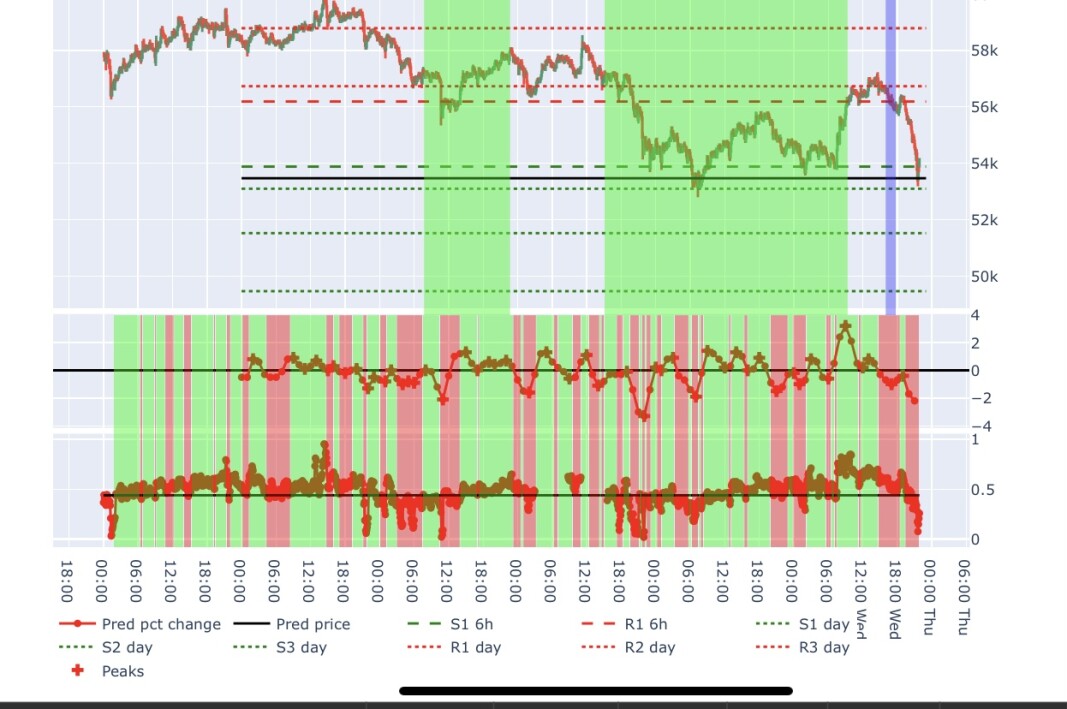
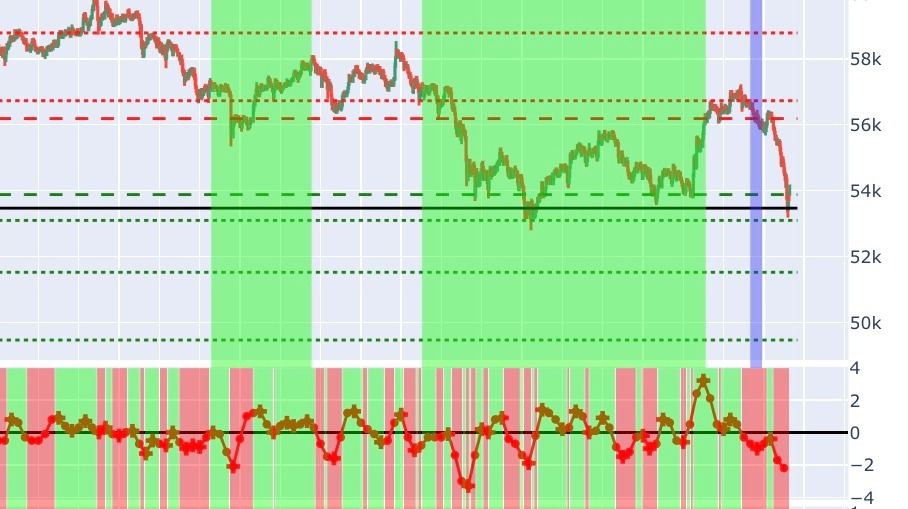
The chart consist of three sub plots along the same time series. The upper subplot contains historical ohlc price, together with the pivot points for support and resistance. The pivot point are for 6h, 1 day, 2 days and 3 days. The black line is the predicted price the next two hours. The rectangle shows the start and end of closed positions. There are four different potential outcomes of a closed position.
- Long gain - Green rectangle
- Short gain - Blue rectangle
- Long loss - Red rectangle
- Short loss - Pink rectangle
The middle subplot shows the predicted percentage change the next two hours. The lower sub plot shows the position between support 1 day and resistance 1 day. The colored rectangle on the two lower sub plots shows the trend according to the directional change described above, using a threshold of 0.7%.
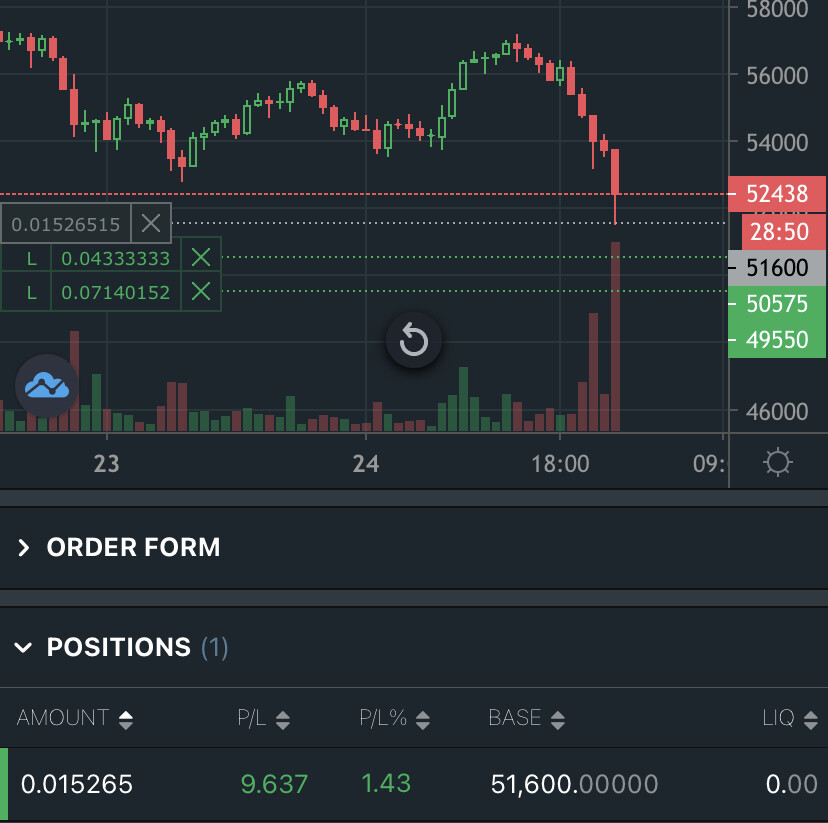
Current open positions and closing strategies
On the chart the blue horizontal line is my current base price. Blue vertical line is point in time I opened the first position, if I have added to a position the intersection of the blue vertical line and horizontal line will not hit the ohlc bars.
My first entry was executed just at the tail.
Entry strategies and closing strategies
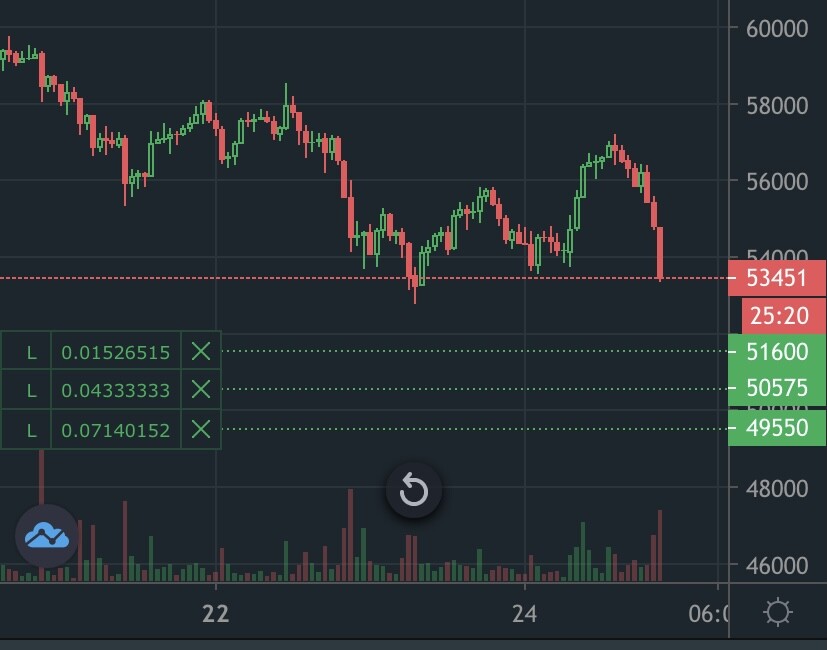
If these limit buy orders are executed I plan to exit around 53450.
This week closed position(s) and lessons learnt
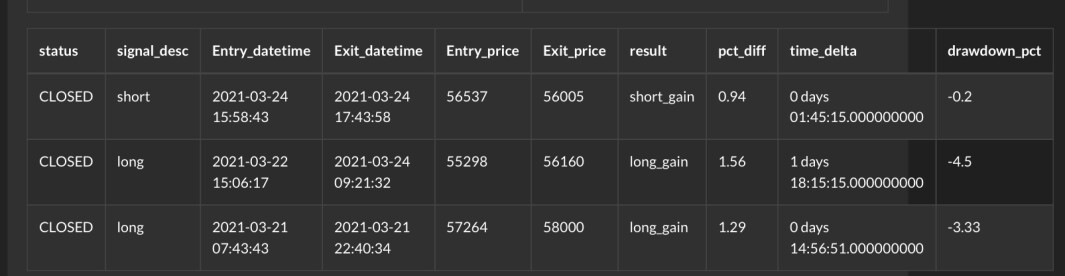
The first long position closed with profit I entered to early and faced a draw down percentage of 3.33%, only to gain 1.29%. However I was able to exit in a local top. The second long position closed with profit I also entered to early, however the first entry was with a relative small position which I kept adding to with the purpose of lowering my base price. At the end I was able to exit, however the exit was too early.
The last position was a short position closed with profit. It was a good entry at top, however I should have kept the short position with a trailing stop as I could have gained much more. I feel very nervous when opening short position in this market, and I don't recommend to do it.
Topics next post
I'm happy to post more details about the type of machine learning and input parameters, the data pipeline or any other questions you might have. Please provide the questions in the comments field you would like to see answered and I will create a follow-up post where I will share some more insights.