Checking in on the BTC chart...
Bittfinex BTC/USD Daily
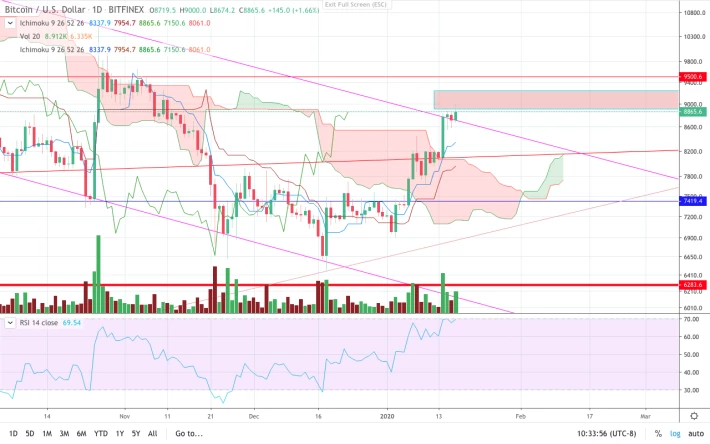
The pink trend line here represents the top of the downtrend that began back in July.
While this is a nice sign of strength, I must interject some bearish insight by pointing out the volume upon breaking this trend line . It is not quite as strong as I was looking for but with that said, it is an uptick in volume .
What might this mean for trading?
One possibility is BTC could follow down that trend-line for a few days towards the new green cloud. Perhaps before testing the resistance block once again (red box). This box represents the resistance that is shown by the Ichimoku cloud. If you look back to the last green cloud you will notice that this is where I placed the resistance box.
Another possibility... is that BTC continues to pound that resistance box until it breaks through.
In one of my previous posts I pointed out the resistance here, along with it potentially lasting til March.
Thanks for reading!






