
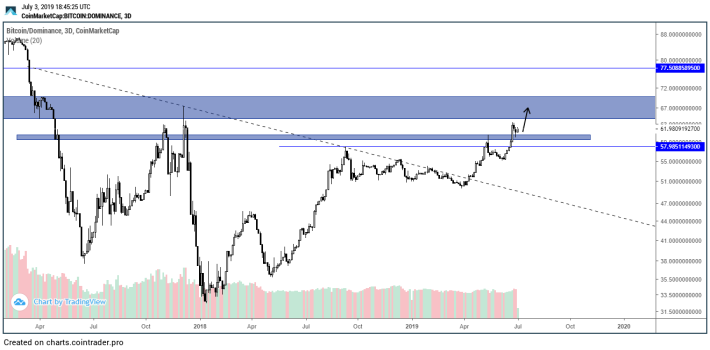
The market for cryptocurrencies has been very active on the eve of July 4, with strong recoveries in Bitcoin and the rest of the altcoins following the route indicated by the main cryptographic asset. The inflow of capital flows has meant an upward trend that already touches the double digit for BTC, with a market capitalization of the entire market that is around $ 335 billion dollars and a BTC domain that already stands at 63 percent.
![]()
And precisely this domain of BTC has broken a level of projected diagonal resistance that expects to approach levels of 70 percentage points for this month of July, as we can see the chart below CoinMarketCap.
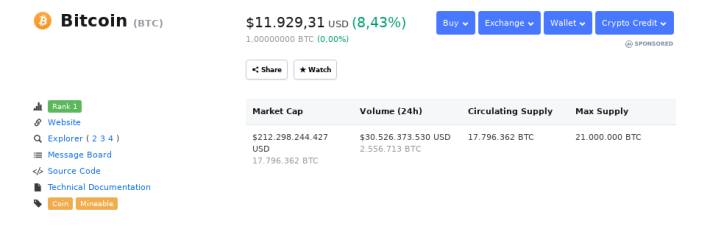
At the time of writing BTC quotes close to 12k, with a spot price of BTC \ USD to $ 11929.31 and a recovery of 8.43% in its prices in the last 24 hours. Its daily volume has increased to the figure of $ 30 billion dollars.
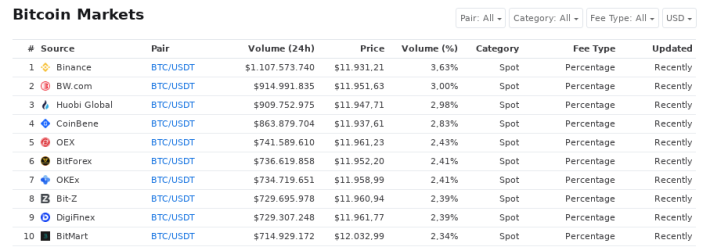
The BTC market is dominated by the giant exchange Binance with its BTC \ USDT pair contributing 3.63% of the market share of BTC.
In the short term, BTC has an interesting scenario. BTC has entered a zone of key resistance that will be fundamental to break to return to levels of 13k. Already his projected resistance slope has been far exceeded in this opportunity and everything seems to indicate that he will not have any problem in retaking levels achieved last week.
The weekly opening is your support zone between the limits bands @ $ 10800- $ 11000 and your foothold that has allowed you to reach this current scenario we saw just found a couple of days below the levels of $ 9800 in the trap of Bears.
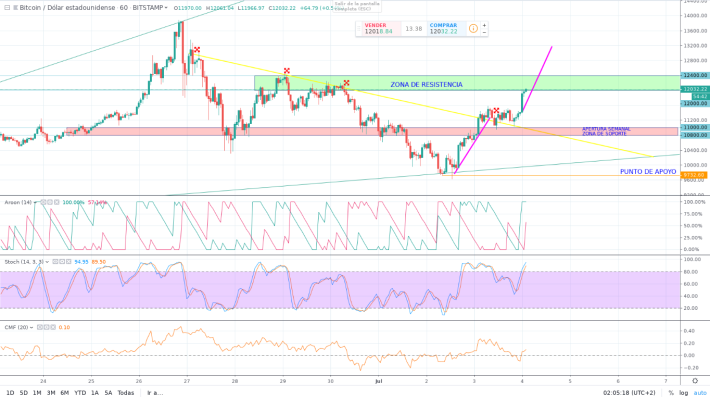
In this short-term chart, Aroon Uptrend remains at the top of the chart signaling the BTC bullish moment.
Stochastic for its part is already in overbought FOMO levels approaching incredibly at perfect levels of 100.
Finally, the CMF indicator tells us that capital has begun to flow into the ecosystem with a large percentage, as we saw earlier in the BTC market, which has allowed it to boost up to now the near 12k band.
For the medium-long term, BTC's outlook is promising. At this moment we are witnessing once again a new cyclical pattern that already occurred in the month of September 2017, three months before the great capitulation of BTC at historic highs.
In the graph of 1D in Binance for the cryptocurrency we can appreciate this pattern that is currently occurring and its graphical accuracy coinciding with the current resistance and support levels.
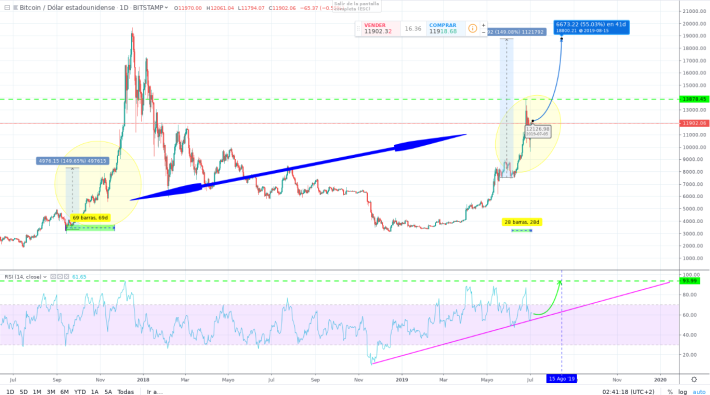
In 2017, in this particular cycle, BTC achieved a maximum of 149% growth in its prices at that time, going from 3325.23 to 8301.38 in just 69 days.
Currently, BTC has fulfilled the first half of that pattern in just 28 days, going from 7524.76 to the maximum price of the year @ 13878.45 reached at the end of last month, 84.39%.
If the pattern is repeated identically in time and value, as other opportunities have occurred with the cryptocurrency this year, we could then see BTC for the middle of this quarter Q3 2019 reach a maximum of 18742.68.
That is, BTC could reach + 55.03% in the medium term if no external event cuts its projected bullish rally.
However, analogously to the aforementioned, studying the RSI indicator, we can see that BTC has not yet reached key levels of RSI: 93.99 in the medium term, which is the coincident value of our repeated projection of 2017.
If the analysis is correct and BTC essentially repeats all its patterns, then we should see a totally positive disruptive news so that the purchasing pressure grows to such a magnitude of RSI at the projected time. Otherwise, BTC will gradually continue to close to its record for next year, as the halving approaches.
For now, BTC has enough fundamental support to be able to capitulate to new highs. The number of uses behind its underlying technology and increasing adoption has generated more interest in the cryptocurrency, in addition to the political instability that dominates the global landscape that has allowed BTC to gain a place alongside gold as a store of value, despite its high volatility.


