
Hey Folks. I got my eye on a possible trade setup for Polkadot (DOT) on the Day Chart.
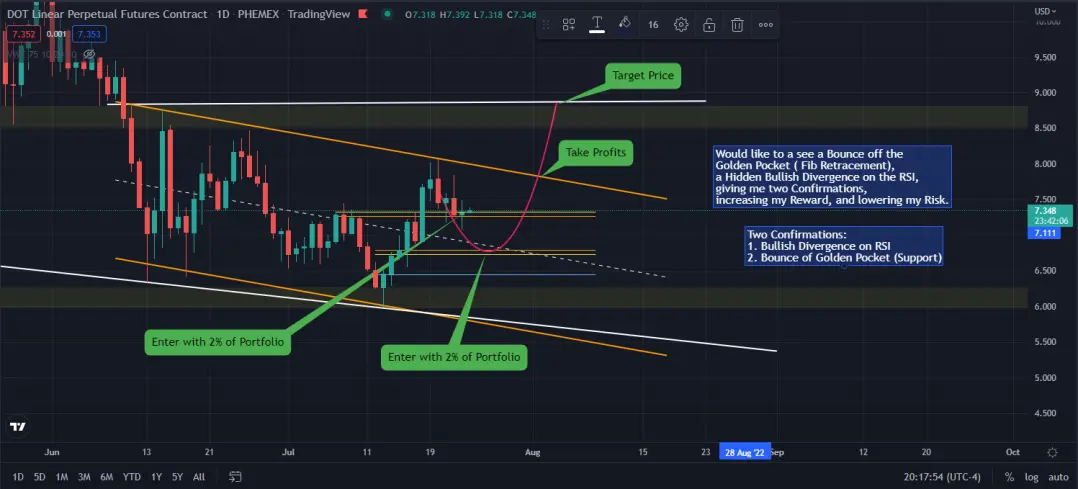
On the chart above I've listed my current plan for Polkadot, I enter the trade at $7.19 with 2% of my trading Account, and if price continues to fall, I'm looking to add to my Long Position at or near $6.76 in the Golden Pocket, with my Stop Loss below the 0.786 using the Fib Retracement Tool.
Before adding to my Long Position, I would like to see some Conformations. The more conformations received, the higher the probabilities are in my favour. I got my eye 2 Conformations, a Bounce off the Golden Pocket, and a Hidden Bullish Divergence on the RSI.
Note: If Price Action Fails to generate at least 2 Confirmations, I will not add to Long Position.
2 Conformations
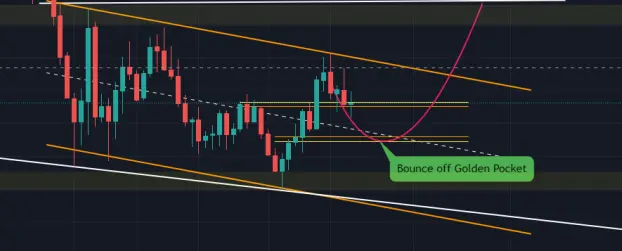
Conformation 1 - Bounce off Golden Pocket
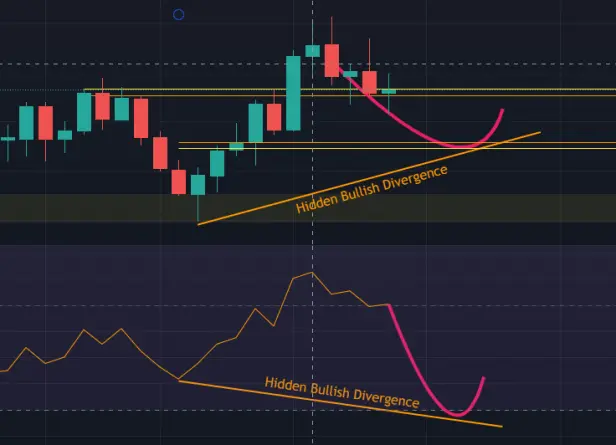
Conformation 2 - Hidden Bullish Divergence - RSI (Lower Time Frames)
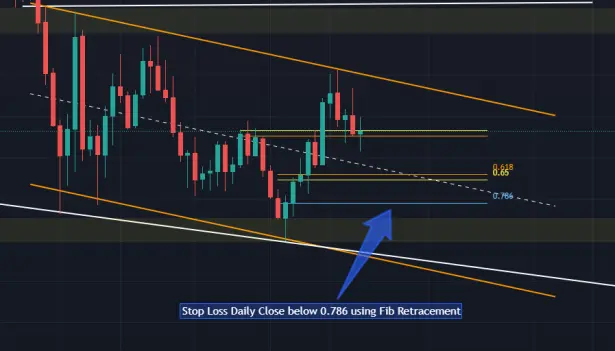
Stop Loss - Daily Candle Close below 0.786 (Fib Retracement)
I will take Profits at Resistance Area, and depending on price action I may close entire trade, or let the rest ride for long as possible, while moving my Stop Loss as Price Action rises, insuring profits. But Markets can change at anytime, and depending on price action, I may revaluate my position. Nothing is set in stone. For no trader can predict the markets. The best that traders can do is to determine the probabilities in which direction it will go.
Note: This trade is a Swing Trade. Anywhere from a couple days to a week or two, possibly more.
It is important to note, the trade may not materialize. Not Financial Advice
Please Take Note: Price Action on Day Charts can take some time to play out. Anywhere from a couple days to couple of weeks.






