
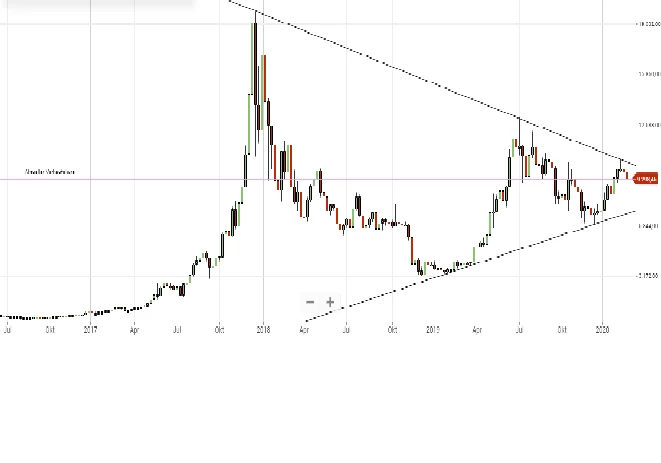
The picture on top shows the price of Bitcoin on the weekly timeframe.
Instead of looking at smaller timeframes, I decided to take a look at the big picture, which shows the price of Bitcoin holding support an being pushed off by two trendlines which proofed their significance several times.
The trendline acting as resistance has been tested for three times in the last 26 months and connects the All-time-high with the top of the last run up (which found his top at approx. 13.800 USD) and the recent top we were forming on February 14th.
The trendline acting as support showed its significance in early 2019 by being tested several times. Bitcoin also bounced off this support-line in December 2019, when the price formed a local bottom.
While breaking the support-line could mark the start of a new downtrend, breaking the resistance line would most probably lead to more upside price-action and would be a strong argument for a sustainable bull run in the coming years.
The formation, this two trendlines are forming, is called “symmetrical triangle”.
A symmetrical triangle is a bullish continuation pattern, that tends to break to the upside.
Summary
Aside from short-term price drops, which probably all crypto hodlers experienced enough for the last years, the long-term price action shows, that the price of Bitcoin tends to be bullish.
In no way I’m saying, that Bitcoin has to break bullish and this of course isn’t any kind of financial advice, but with all the developments and afford, that is brought in to make Bitcoin “mainstream”, plus the long-term chart analysis, makes me feel comfortable investing in Bitcoin.
This is the first article I ever wrote for a Blog an English is not my mother tongue, so please forgive me my grammatical mistakes and feel free to correct my language in the comment section.
I’m also looking forward for discussions with you in the comment section.






