
The markets are crashing and Bitcoin is no exception. In the last 24 hours, the price of the worlds leading cryptocurrency went from 8750$ to 7680$ which is a decrease of approximately 12%.
Even though long term bitcoin investors (like you) should already be used to market swings like this, the chart, dominated by red candles, makes our hearts beat faster.
But is there a reason for panic?
In my last article I pointed out, that I would not be surprised by bitcoin breaking the 20 week moving average, which turned out to be a key indicator for bitcoin being in a bull-market or not.
The reason I’m not surprised is, that it’s always the same game that is being played. The Crypto-space (especially Crypto-Youtubers) tries to focus all our attention on this one indicator that matches perfectly for short term bitcoin moon predictions.
“History repeats itself!!!”
This statement might be true talking about the replication of political views and yes sometimes we can actually point out fractals in the charts, that seem to be mirrored from the past, but you can never tell the future by looking at the past.
Back to Bitcoin
As I am done with my life-lessons (kind of ironic coming from a 26 year old), I want to go on and talk about the facts I can see in the charts.
In my last article I talked about the next support for the price of bitcoin after breaking the 20 week moving average and it turned out to be accurate.
The trend-line acting as support showed its significance in early 2019 by being tested several times. Bitcoin also bounced off this support-line in December 2019, when the price formed a local bottom.
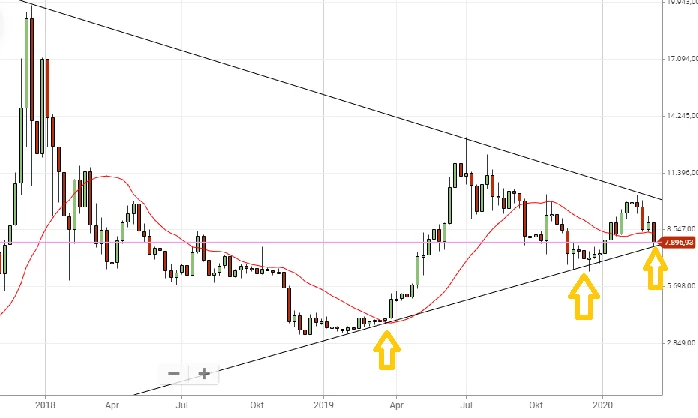
As you can see in the chart, the price of bitcoin perfectly dipped into the one year trend-line and successfully proofed it as support.
It`s getting close
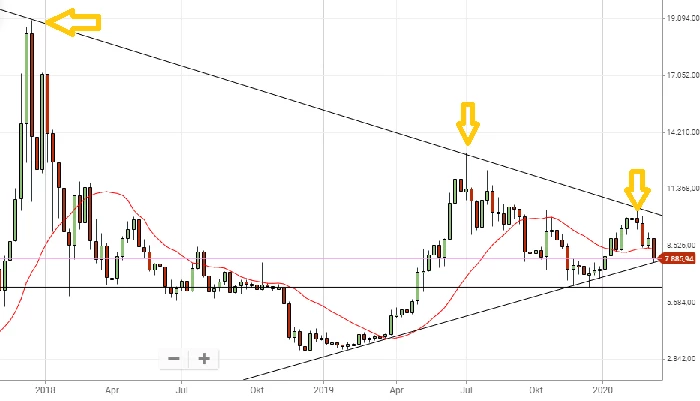
By retesting the support line, Bitcoin once again confirmed my theory, that the price built a symmetrical triangle, which is formed by the one year support and a trend-line acting as resistance that has been tested for three times in the last 26 months and connects the All-time-high with the top of the last run up (which found his top at approx. 13.800$) and the recent top we were forming on February 14th.
What if?
What if we break this support-line?
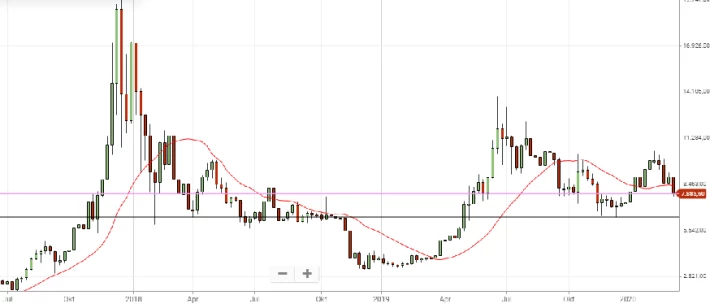
The next strong support for the price of Bitcoin is at around 6500$. As you can see in the chart, this level provided support for the price of Bitcoin several times in the past, but as long as we don’t break this key support-line, we are still in a symmetrical triangle formation, which is a…
bullish continuation pattern!
This is no financial advice!
Always do your own research!






