
Bitcoin has broken historical records in the last two weeks. After overcoming the $ 30,000 psychological resistance, it seems that many investors have become interested in this market, and this has caused the price of Bitcoin to jump these days. You can see the chart of bitcoin price in weekly time below.
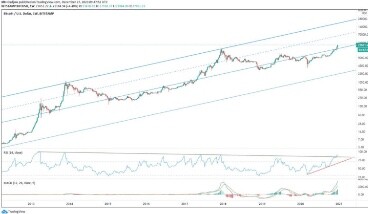
As mentioned earlier, in the weekly time frame, Bitcoin is in an uptrend channel that moves across the midline to the channel ceiling. The channel ceiling represents ambitious goals for Bitcoin, which from a fundamental point of view, given that Bitcoin today accounts for about 72% of the digital currency market, crossing this range requires new capital to enter the market.
Many tech analysts expected Bitcoin to start correction and pullback to the channel midfield after reaching the price of 33000, but buyers had a different opinion. The historical resistance line is broken in the RSI indicator, and considering that the RSI is in the range of buying excitement, it is not far-fetched to expect a sudden rise in price. The convergence between the price chart and the Makdi and RSI indicators will indicate that the price does not intend to stop its uptrend at the moment.
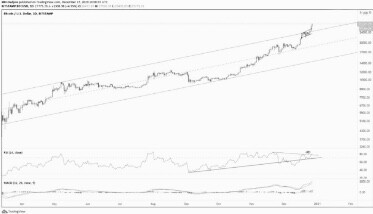
In daily time, bitcoin can also be considered in a medium-term channel. After returning from the midline of the canal and crossing the $ 30,000 mark, the price fluctuated within the canal ceiling for a few days and left it behind. As the price reached the ceiling of the Makedi histogram channel, it lowered its height and the RSI indicator was forming a divergence, but the re-increase of the histogram caused the divergence to be lost, as a result of which the price crossed the $33,000 mark.
In the daily time, there is a convergence between the price chart and the Makdi and RSI indicators, which is a sign of the tendency to maintain the uptrend.
Due to the failure of the medium-term channel, the initial price targets can be considered in a channel parallel to the broken channel.
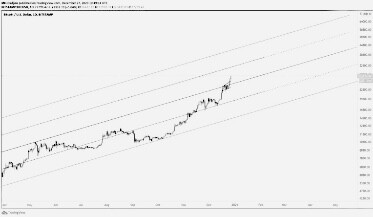
Considering the support line in RSI as the first loss limit, the internal lines of the new price channel can be considered as its price targets. Although technically Bitcoin should have a pullback to the 30,000 line in the short term, whales that have entered the market in the range of 28,000 to 33,000 are currently reluctant to retreat.