
Longterm analysis
On the daily chart, the situation is unchanged.
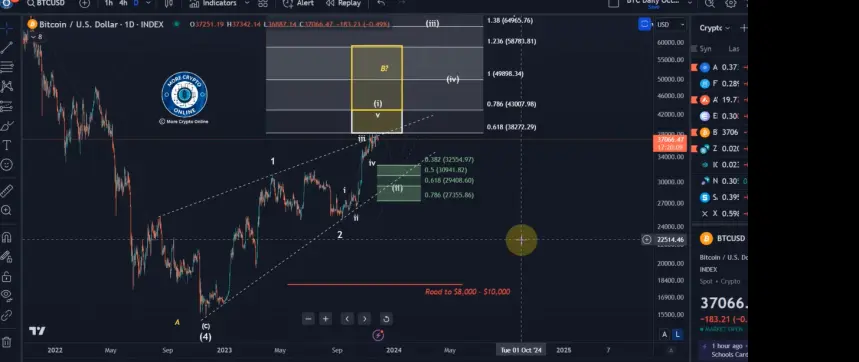
We want to look at the daily chart occasionally in order to better understand the longterm trend.
We are currently in a bullish structure, which may change with a break below $27,350, the 78.6 retrace of the rally starting on September 11.
The market completed five waves up into the April highs, followed by a three-wave pullback and another five-wave move up, forming a one-two-one structure.
This forecast holds as long as the price stays above $27,350. Breaking above $43k could indicate an overheated market, resembling a corrective ABC structure, reducing probabilities for a positive outcome.
In the next few weeks, attention is needed at the $43k level.
If the price corrects, it could set up a wave 2 and a rally into 2024.
Short term
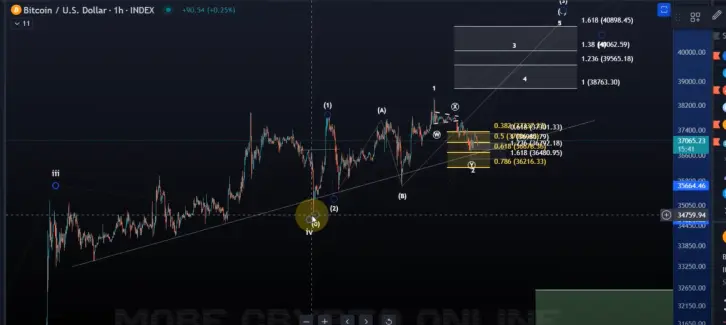
On the shorter timeframe, the rally from September 11 might be finishing, with potential for a little higher.
Bitcoin has been moving above the trend line since late October, with different interpretations of the wave count.
The up-trending scenario is valid as long as the price holds above the B wave low at $35,680, with reduced probabilities below $36,216.
Confirmation of a low requires a break above $37,840, allowing the third wave to target $40k plus.






